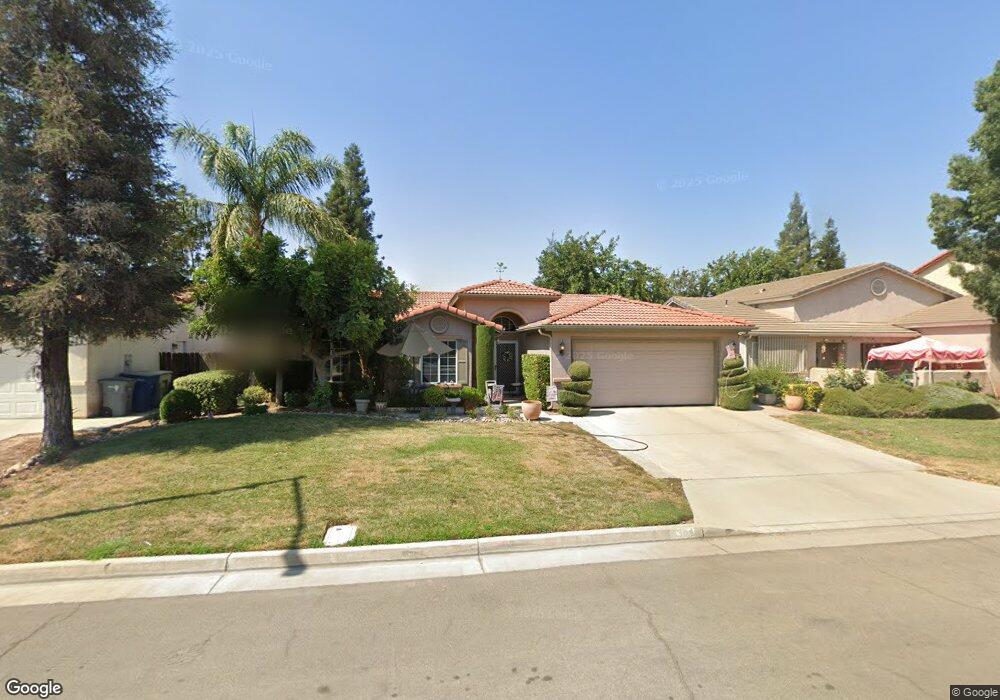
5394 W Flint Way Fresno, CA 93722
West Fresno NeighborhoodEstimated Value: $375,000 - $407,000
3
Beds
2
Baths
1,680
Sq Ft
$231/Sq Ft
Est. Value
About This Home
This home is located at 5394 W Flint Way, Fresno, CA 93722 and is currently estimated at $387,998, approximately $230 per square foot. 5394 W Flint Way is a home located in Fresno County with nearby schools including Harvest Elementary School and Glacier Point Middle School.
Ownership History
Date
Name
Owned For
Owner Type
Purchase Details
Closed on
Jul 21, 2023
Sold by
Olivas Antoinette J
Bought by
Antoinette J Olivas Living Trust and Olivas
Current Estimated Value
Purchase Details
Closed on
Dec 29, 2011
Sold by
Olivas Jesse B
Bought by
Olivas Antoinette J
Purchase Details
Closed on
Aug 6, 2002
Sold by
Olivas Jesse B and Olivas Antoinette J
Bought by
Olivas Jesse B and Olivas Antoinette J
Home Financials for this Owner
Home Financials are based on the most recent Mortgage that was taken out on this home.
Original Mortgage
$112,800
Interest Rate
6.43%
Purchase Details
Closed on
Aug 18, 1999
Sold by
Butler Rocca I
Bought by
Olivas Jesse B and Jaramillo Antoninette J
Home Financials for this Owner
Home Financials are based on the most recent Mortgage that was taken out on this home.
Original Mortgage
$112,826
Interest Rate
7.66%
Mortgage Type
FHA
Create a Home Valuation Report for This Property
The Home Valuation Report is an in-depth analysis detailing your home's value as well as a comparison with similar homes in the area
Home Values in the Area
Average Home Value in this Area
Purchase History
| Date | Buyer | Sale Price | Title Company |
|---|---|---|---|
| Antoinette J Olivas Living Trust | -- | None Listed On Document | |
| Olivas Antoinette J | -- | None Available | |
| Olivas Jesse B | -- | Chicago Title Co | |
| Olivas Jesse B | $114,000 | Financial Title Company |
Source: Public Records
Mortgage History
| Date | Status | Borrower | Loan Amount |
|---|---|---|---|
| Previous Owner | Olivas Jesse B | $112,800 | |
| Previous Owner | Olivas Jesse B | $112,826 |
Source: Public Records
Tax History Compared to Growth
Tax History
| Year | Tax Paid | Tax Assessment Tax Assessment Total Assessment is a certain percentage of the fair market value that is determined by local assessors to be the total taxable value of land and additions on the property. | Land | Improvement |
|---|---|---|---|---|
| 2025 | $2,138 | $173,656 | $46,095 | $127,561 |
| 2023 | $2,092 | $166,914 | $44,306 | $122,608 |
| 2022 | $1,975 | $163,642 | $43,438 | $120,204 |
| 2021 | $1,988 | $160,435 | $42,587 | $117,848 |
| 2020 | $1,891 | $158,791 | $42,151 | $116,640 |
| 2019 | $1,862 | $155,678 | $41,325 | $114,353 |
| 2018 | $1,818 | $152,626 | $40,515 | $112,111 |
| 2017 | $1,823 | $149,634 | $39,721 | $109,913 |
| 2016 | $1,681 | $146,701 | $38,943 | $107,758 |
| 2015 | $1,673 | $144,499 | $38,359 | $106,140 |
| 2014 | $1,670 | $141,669 | $37,608 | $104,061 |
Source: Public Records
Map
Nearby Homes
- 5443 W Flint Way
- 3689 N Mccaffrey Ave
- 5566 W Farrin Ave
- 5958 W Austin Way
- 5314 W Ramona Ave
- 5323 W Garland Ave
- 3292 N Wheeler Ave
- 3340 N Dante Ave
- 3864 N Forestiere Ave
- 5028 W Robinson Ave
- 5769 W Austin Way
- 4739 W Bellaire Way
- 3442 N Olinda Ave
- 5761 W Willis Ave
- 6064 W Lansing Way
- 6072 W Lansing Way
- 6080 W Lansing Way
- 6088 W Lansing Way
- Platte Plan at Terra Toscana at Fanucchi Ranch - Terra Toscana
- Marion Plan at Terra Toscana at Fanucchi Ranch - Terra Toscana
- 5382 W Flint Way
- 5406 W Flint Way
- 5395 W Saginaw Way
- 5381 W Saginaw Way
- 5405 W Saginaw Way
- 5370 W Flint Way
- 5418 W Flint Way
- 5395 W Flint Way
- 5417 W Saginaw Way
- 5369 W Saginaw Way
- 5407 W Flint Way
- 5383 W Flint Way
- 5358 W Flint Way
- 5430 W Flint Way
- 5419 W Flint Way
- 5371 W Flint Way
- 5357 W Saginaw Way
- 5429 W Saginaw Way
- 5431 W Flint Way
- 5359 W Flint Way