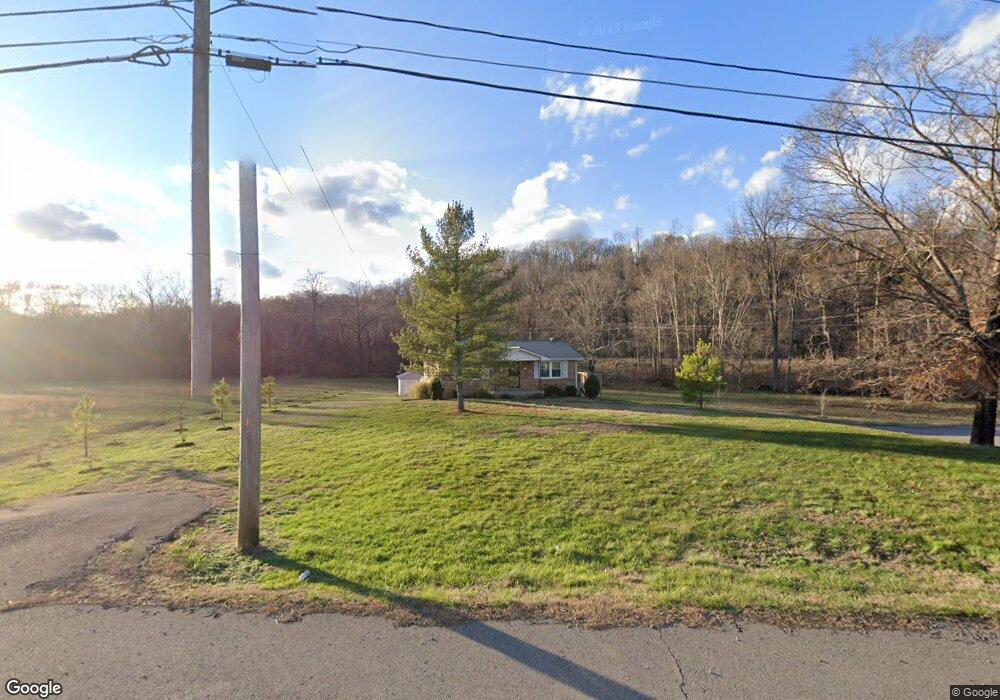
5395 Highway 48 N Cumberland Furnace, TN 37051
Estimated Value: $222,000 - $344,163
--
Bed
2
Baths
1,026
Sq Ft
$279/Sq Ft
Est. Value
About This Home
This home is located at 5395 Highway 48 N, Cumberland Furnace, TN 37051 and is currently estimated at $286,541, approximately $279 per square foot. 5395 Highway 48 N is a home located in Dickson County with nearby schools including Vanleer Elementary School, Charlotte Middle School, and Creek Wood High School.
Ownership History
Date
Name
Owned For
Owner Type
Purchase Details
Closed on
Jan 24, 2024
Sold by
Yoder Elmer Paul
Bought by
Roderick Jonathan
Current Estimated Value
Home Financials for this Owner
Home Financials are based on the most recent Mortgage that was taken out on this home.
Original Mortgage
$312,000
Outstanding Balance
$306,540
Interest Rate
6.95%
Mortgage Type
VA
Estimated Equity
-$19,999
Purchase Details
Closed on
Nov 30, 2022
Sold by
Yoder Philip E and Yoder Marietta K
Bought by
Yoder Elmer Paul
Purchase Details
Closed on
Aug 20, 2018
Sold by
Rector Rushie J Estate
Bought by
Yoder Philip and Yoder Marietta K
Purchase Details
Closed on
Jun 2, 2007
Sold by
Rector Rushie
Bought by
State Of Tennessee
Purchase Details
Closed on
Jul 18, 1990
Bought by
Rector Rushie
Purchase Details
Closed on
Apr 18, 1988
Bought by
Owens Johnny W
Purchase Details
Closed on
Mar 30, 1987
Bought by
Johnny Owen Bancboston Mort Corp
Purchase Details
Closed on
May 23, 1983
Bought by
Brant Robt E and Brant Linda
Create a Home Valuation Report for This Property
The Home Valuation Report is an in-depth analysis detailing your home's value as well as a comparison with similar homes in the area
Home Values in the Area
Average Home Value in this Area
Purchase History
| Date | Buyer | Sale Price | Title Company |
|---|---|---|---|
| Roderick Jonathan | $312,000 | Title Group Of Tennessee | |
| Yoder Elmer Paul | $110,000 | -- | |
| Yoder Philip | $100,500 | -- | |
| State Of Tennessee | $1,000 | -- | |
| Rector Rushie | $31,500 | -- | |
| Owens Johnny W | $49,400 | -- | |
| Johnny Owen Bancboston Mort Corp | $44,300 | -- | |
| Brant Robt E | -- | -- |
Source: Public Records
Mortgage History
| Date | Status | Borrower | Loan Amount |
|---|---|---|---|
| Open | Roderick Jonathan | $312,000 |
Source: Public Records
Tax History Compared to Growth
Tax History
| Year | Tax Paid | Tax Assessment Tax Assessment Total Assessment is a certain percentage of the fair market value that is determined by local assessors to be the total taxable value of land and additions on the property. | Land | Improvement |
|---|---|---|---|---|
| 2025 | $901 | $53,325 | $0 | $0 |
| 2024 | $901 | $53,325 | $11,700 | $41,625 |
| 2023 | $839 | $35,700 | $5,600 | $30,100 |
| 2022 | $839 | $35,700 | $5,600 | $30,100 |
| 2021 | $839 | $35,700 | $5,600 | $30,100 |
| 2020 | $839 | $35,700 | $5,600 | $30,100 |
| 2019 | $839 | $35,700 | $5,600 | $30,100 |
| 2018 | $715 | $26,475 | $4,850 | $21,625 |
| 2017 | $715 | $26,475 | $4,850 | $21,625 |
| 2016 | $715 | $26,475 | $4,850 | $21,625 |
| 2015 | $665 | $22,925 | $4,850 | $18,075 |
| 2014 | $665 | $22,925 | $4,850 | $18,075 |
Source: Public Records
Map
Nearby Homes
- 199 Perry Rd
- 1115 Highway 48 N
- 1313 Stayton Rd
- 1901 Soules Chapel Rd
- 0 Batson Rd
- 6466 Highway 48 N
- 2497 Foster Rd
- 2460 Little Bartons Creek Rd
- 1119 Gallion Rd
- 6 Oak Ridge Rd
- 5 Oak Ridge Rd
- 4 Oak Ridge Rd
- 3L Oak Ridge Rd
- 2L Oak Ridge Rd
- 1L Oak Ridge Rd
- 1038 Maple Valley Rd
- 0 Freeman Loop
- 2600 Little Bartons Creek Rd
- 1260 Mount Herman Rd
- 0 Shelter Branch Rd
- 5395 Highway 48 N
- 5340 Highway 48 N
- 1053 Leach Rd
- 1049 Earl Leach Rd
- 1045 Earl Leach Rd
- 1126 Earl Leach Rd
- 1020 Old Highway 48 N
- 5279 Highway 48 N
- 1100 Leech Rd
- 1030 Hunt Rd
- 5335 Highway 48 N
- 1015 Hilltop Rd
- 1105 Earl Leach Rd
- 1125 Leach Rd
- 1017 Hilltop Rd
- 1035 Old Highway 48 N
- 1055 Starks Rd
- 1030 Old Highway 48 N
- 1019 Hilltop Rd
- 1038 Old Highway 48 N