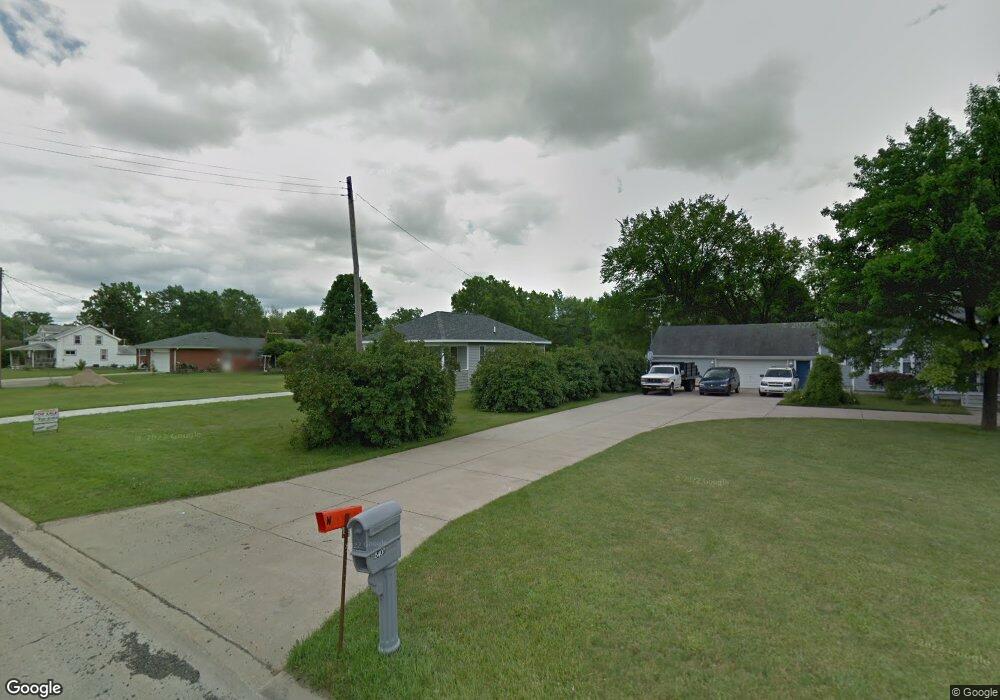
5397 Flushing Rd Flushing, MI 48433
Estimated Value: $122,000 - $197,000
3
Beds
2
Baths
1,012
Sq Ft
$158/Sq Ft
Est. Value
About This Home
This home is located at 5397 Flushing Rd, Flushing, MI 48433 and is currently estimated at $160,279, approximately $158 per square foot. 5397 Flushing Rd is a home located in Genesee County with nearby schools including Elms Elementary School, Flushing Middle School, and Flushing High School.
Ownership History
Date
Name
Owned For
Owner Type
Purchase Details
Closed on
Jan 27, 2026
Sold by
Welker David J
Bought by
Welker David J and Welker Randa L
Current Estimated Value
Purchase Details
Closed on
Mar 3, 2014
Sold by
Welker Randa L B
Bought by
Welker David J
Purchase Details
Closed on
Aug 19, 2011
Sold by
Taylor Kenneth N and Taylor Robin L
Bought by
Welker David J and Welker Randa
Purchase Details
Closed on
Nov 2, 2007
Sold by
Klopf Theodore D
Bought by
Wells Fargo Bank Na and Mlmi Trust Series 2005-Ffh1
Purchase Details
Closed on
Apr 26, 2005
Sold by
Farrow Kenneth C and Steiner Heather A
Bought by
Klopf Theodore D
Home Financials for this Owner
Home Financials are based on the most recent Mortgage that was taken out on this home.
Original Mortgage
$100,000
Interest Rate
8.75%
Mortgage Type
Stand Alone First
Create a Home Valuation Report for This Property
The Home Valuation Report is an in-depth analysis detailing your home's value as well as a comparison with similar homes in the area
Home Values in the Area
Average Home Value in this Area
Purchase History
| Date | Buyer | Sale Price | Title Company |
|---|---|---|---|
| Welker David J | -- | None Listed On Document | |
| Welker David J | -- | None Available | |
| Welker David J | $69,900 | Mason Burgess Title Agency | |
| Wells Fargo Bank Na | $105,412 | None Available | |
| Klopf Theodore D | $100,000 | Garrow Title Agency |
Source: Public Records
Mortgage History
| Date | Status | Borrower | Loan Amount |
|---|---|---|---|
| Previous Owner | Klopf Theodore D | $100,000 |
Source: Public Records
Tax History
| Year | Tax Paid | Tax Assessment Tax Assessment Total Assessment is a certain percentage of the fair market value that is determined by local assessors to be the total taxable value of land and additions on the property. | Land | Improvement |
|---|---|---|---|---|
| 2025 | $1,290 | $56,200 | $0 | $0 |
| 2024 | $634 | $53,000 | $0 | $0 |
| 2023 | $605 | $45,600 | $0 | $0 |
| 2022 | $588 | $38,300 | $0 | $0 |
| 2021 | $569 | $37,200 | $0 | $0 |
| 2020 | $567 | $33,200 | $0 | $0 |
| 2019 | $561 | $33,000 | $0 | $0 |
| 2018 | $1,066 | $28,100 | $0 | $0 |
| 2017 | $993 | $28,100 | $0 | $0 |
| 2016 | $996 | $26,100 | $0 | $0 |
| 2015 | $869 | $26,100 | $0 | $0 |
| 2014 | $494 | $25,400 | $0 | $0 |
| 2012 | -- | $22,200 | $22,200 | $0 |
Source: Public Records
Map
Nearby Homes
- 2340 Pineview Ct
- 2371 Pineview Ct
- 2218 Disch St
- 2372 Meadow St
- 5442 Meadow Creek Ct
- 6123 E River Rd
- 5411 River Meadow Blvd
- 00 Emeraldwood Trail
- 2008 Beekman Ct
- 74 Emeraldwood Trail
- 60 Emeraldwood Trail
- 3200 Amelia Ave
- 6273 Boulder Dr
- 6268 Boulder Dr
- 6551 River Rd
- 2365 Flagstone Dr
- VL N Linden Rd
- 6318 Laurentian Ct Unit Building 9 APT 42
- 5021 Forest Side Dr
- 6302 Laurentian Ct
- 5383 Flushing Rd
- 5407 Flushing Rd
- 5377 Flushing Rd
- 5357 Flushing Rd
- 5351 Flushing Rd
- 5429 Flushing Rd
- 5347 Flushing Rd
- 5341 Flushing Rd
- 5337 Flushing Rd
- 5337 Flushing Rd
- 5402 Flushing Rd
- 5414 Flushing Rd
- 5327 Flushing Rd
- 5360 Flushing Rd
- 5360 Flushing Rd
- 5396 Flushing Rd
- 5321 Flushing Rd
- 5449 Flushing Rd
- 2722 Timber Lane Dr
- 2722 Timber Lane Dr Unit 20
Your Personal Tour Guide
Ask me questions while you tour the home.