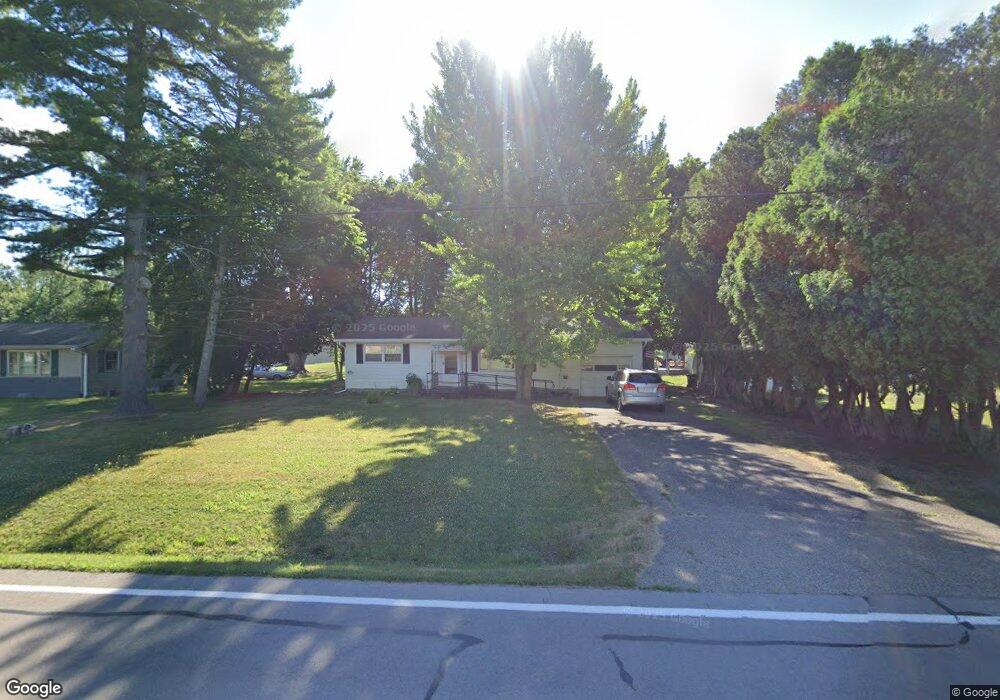
5399 Arlington Rd Clinton, OH 44216
Estimated Value: $172,000 - $218,000
2
Beds
1
Bath
864
Sq Ft
$219/Sq Ft
Est. Value
About This Home
This home is located at 5399 Arlington Rd, Clinton, OH 44216 and is currently estimated at $188,856, approximately $218 per square foot. 5399 Arlington Rd is a home located in Summit County with nearby schools including Greenwood Elementary School, Green Intermediate Elementary School, and Green Primary School.
Ownership History
Date
Name
Owned For
Owner Type
Purchase Details
Closed on
May 1, 2020
Sold by
Young Iii Robert F and Young Tina L
Bought by
Templeton Llc
Current Estimated Value
Purchase Details
Closed on
Apr 21, 2020
Sold by
Young Iii Robert F and Young Tina L
Bought by
Templeton Llc
Purchase Details
Closed on
Jul 10, 2009
Sold by
Us Bank National Association
Bought by
Young Robert F
Purchase Details
Closed on
Jun 17, 2009
Sold by
Goff Chiara E
Bought by
Us Bank National Association
Purchase Details
Closed on
Jun 23, 2005
Sold by
Campbell James M and Switzer Dorothy M
Bought by
Goff Anthony R and Goff Chiara E
Home Financials for this Owner
Home Financials are based on the most recent Mortgage that was taken out on this home.
Original Mortgage
$67,200
Interest Rate
8.1%
Mortgage Type
Fannie Mae Freddie Mac
Create a Home Valuation Report for This Property
The Home Valuation Report is an in-depth analysis detailing your home's value as well as a comparison with similar homes in the area
Home Values in the Area
Average Home Value in this Area
Purchase History
| Date | Buyer | Sale Price | Title Company |
|---|---|---|---|
| Templeton Llc | -- | None Listed On Document | |
| Templeton Llc | -- | None Listed On Document | |
| Young Robert F | $30,000 | Title Plus Services | |
| Us Bank National Association | $52,000 | None Available | |
| Goff Anthony R | $84,000 | Wigley Title Agency Inc |
Source: Public Records
Mortgage History
| Date | Status | Borrower | Loan Amount |
|---|---|---|---|
| Previous Owner | Goff Anthony R | $67,200 | |
| Closed | Goff Anthony R | $16,800 |
Source: Public Records
Tax History Compared to Growth
Tax History
| Year | Tax Paid | Tax Assessment Tax Assessment Total Assessment is a certain percentage of the fair market value that is determined by local assessors to be the total taxable value of land and additions on the property. | Land | Improvement |
|---|---|---|---|---|
| 2025 | $2,452 | $47,950 | $15,540 | $32,410 |
| 2024 | $2,452 | $51,065 | $15,540 | $35,525 |
| 2023 | $2,452 | $51,065 | $15,540 | $35,525 |
| 2022 | $1,978 | $37,006 | $11,263 | $25,743 |
| 2021 | $1,857 | $37,006 | $11,263 | $25,743 |
| 2020 | $1,822 | $37,000 | $11,260 | $25,740 |
| 2019 | $1,312 | $24,940 | $12,170 | $12,770 |
| 2018 | $1,442 | $24,940 | $12,170 | $12,770 |
| 2017 | $1,430 | $24,940 | $12,170 | $12,770 |
| 2016 | $1,424 | $24,080 | $12,170 | $11,910 |
| 2015 | $1,430 | $24,080 | $12,170 | $11,910 |
| 2014 | $1,422 | $24,080 | $12,170 | $11,910 |
| 2013 | $1,441 | $24,200 | $12,170 | $12,030 |
Source: Public Records
Map
Nearby Homes
- 5354 Arlington Rd
- 0 S Arlington Rd Unit 4494606
- 5626 Arlington Rd Unit 5628
- 1031 Karla Dr
- 5052 Arlington Rd
- 4909 Timbercreek Cir
- Allegheny Plan at Stoney Creek
- Lehigh Plan at Stoney Creek
- Hudson Plan at Stoney Creek
- Columbia Plan at Stoney Creek
- Aviano Plan at Stoney Creek
- 4870 Firwood Dr
- 1425 Hazeldell Dr
- 5430 Thursby Rd
- 1692 Koons Rd
- 8694 Candlewood Ave NW
- 8176 Staten Cir NW
- 810 Mount Pleasant St NW
- 8640 Foxglove Ave NW
- 8445 Morrilton Cir NW
- 1101 Koons Rd
- 5389 Arlington Rd
- 1096 Koons Rd
- 5406 Arlington Rd
- 5379 Arlington Rd
- 1104 Koons Rd
- 1113 Koons Rd
- 5337 Arlington Rd
- 1114 Koons Rd
- 1114 Koons Rd
- 5362 Arlington Rd
- 5335 Arlington Rd
- 5441 Arlington Rd
- 1133 Koons Rd
- 1130 Koons Rd
- 5451 Arlington Rd
- 5452 Arlington Rd
- 1145 Koons Rd
- 5344 S Arlington Rd
- 5344 Arlington Rd