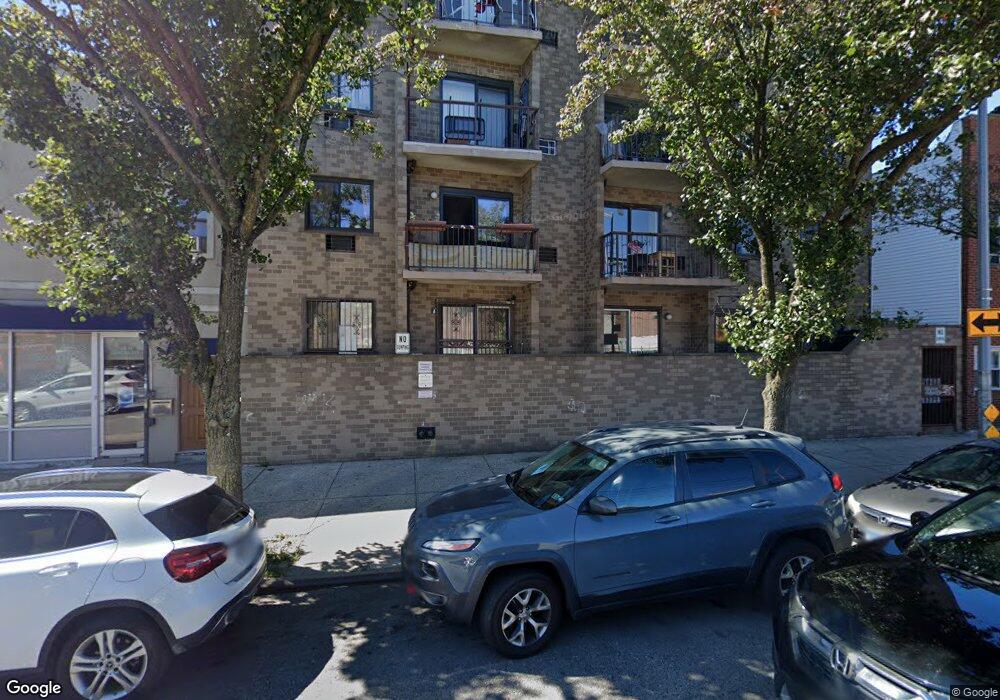
54-09 108th St Unit 3-C Corona, NY 11368
Corona NeighborhoodEstimated Value: $367,000 - $490,000
1
Bed
1
Bath
750
Sq Ft
$567/Sq Ft
Est. Value
About This Home
This home is located at 54-09 108th St Unit 3-C, Corona, NY 11368 and is currently estimated at $424,975, approximately $566 per square foot. 54-09 108th St Unit 3-C is a home located in Queens County with nearby schools including P.S. 14 - Fairview, Is 61 Leonardo Da Vinci, and John Bowne High School.
Ownership History
Date
Name
Owned For
Owner Type
Purchase Details
Closed on
Feb 8, 2019
Sold by
Begum Shahnaz and Persaud Sherwin
Bought by
Lee Homei
Current Estimated Value
Purchase Details
Closed on
May 31, 2006
Sold by
Gatling Tracey L
Bought by
Begum Shahnaz and Persaud Sherwin
Home Financials for this Owner
Home Financials are based on the most recent Mortgage that was taken out on this home.
Original Mortgage
$244,800
Interest Rate
6.62%
Mortgage Type
Purchase Money Mortgage
Purchase Details
Closed on
Sep 16, 1999
Sold by
Eor Fifty Five Of New York Inc
Bought by
Gatling Tracey L
Home Financials for this Owner
Home Financials are based on the most recent Mortgage that was taken out on this home.
Original Mortgage
$90,000
Interest Rate
7.76%
Create a Home Valuation Report for This Property
The Home Valuation Report is an in-depth analysis detailing your home's value as well as a comparison with similar homes in the area
Home Values in the Area
Average Home Value in this Area
Purchase History
| Date | Buyer | Sale Price | Title Company |
|---|---|---|---|
| Lee Homei | $392,000 | -- | |
| Begum Shahnaz | $255,000 | -- | |
| Gatling Tracey L | $96,500 | -- |
Source: Public Records
Mortgage History
| Date | Status | Borrower | Loan Amount |
|---|---|---|---|
| Previous Owner | Begum Shahnaz | $244,800 | |
| Previous Owner | Gatling Tracey L | $90,000 |
Source: Public Records
Tax History Compared to Growth
Tax History
| Year | Tax Paid | Tax Assessment Tax Assessment Total Assessment is a certain percentage of the fair market value that is determined by local assessors to be the total taxable value of land and additions on the property. | Land | Improvement |
|---|---|---|---|---|
| 2025 | $4,763 | $39,382 | $2,919 | $36,463 |
| 2024 | $3,424 | $38,095 | $2,919 | $35,176 |
| 2023 | $3,271 | $37,092 | $2,919 | $34,173 |
| 2022 | $4,470 | $37,979 | $2,919 | $35,060 |
| 2021 | $4,084 | $33,289 | $2,919 | $30,370 |
| 2020 | $4,428 | $38,012 | $2,919 | $35,093 |
| 2019 | $4,172 | $37,421 | $2,919 | $34,502 |
| 2018 | $3,859 | $30,341 | $2,919 | $27,422 |
| 2017 | $3,564 | $28,021 | $2,919 | $25,102 |
| 2016 | $3,365 | $28,021 | $2,919 | $25,102 |
| 2015 | $542 | $24,252 | $2,918 | $21,334 |
| 2014 | $542 | $23,557 | $2,919 | $20,638 |
Source: Public Records
Map
Nearby Homes
- 54-09 108th St Unit 3A
- 5409 108th St Unit 6A
- 108-18 Otis Ave
- 55-14 van Cleef St
- 55-12 van Cleef St
- 10708 Otis Ave
- 5523 van Cleef St
- 55-25 van Cleef St
- 109-12 Westside Ave
- 11021 55th Ave
- 110-25 55th Ave
- 5611 van Cleef St
- 103-18 Martense Ave
- 56-33 Waldron St
- 5609 van Cleef St
- 10364 52nd Ave
- 57-25 Waldron St
- 54-14 111th St
- 5507 103rd St
- 108-51 52nd Ave
- 54-09 108th St Unit 4D
- 54-09 108th St Unit 4A
- 54-09 108th St Unit 5C
- 54-09 108th St Unit 6D
- 54-09 108th St Unit 6B, Flushing
- 54-09 108th St
- 54-09 108th St Unit 6B
- 54-09 108th St Unit 1D
- 54-09 108th St Unit 1C
- 54-09 108th St Unit 1b
- 54-09 108th St Unit 1A
- 54-09 108th St Unit 5E
- 54-09 108th St Unit 2A
- 5415 108th St
- 5417 108th St
- 5419 108th St
- 54-23 108th St
- 5423 108th St
- 5409 108th St Unit 5A
- 5409 108th St Unit 6E