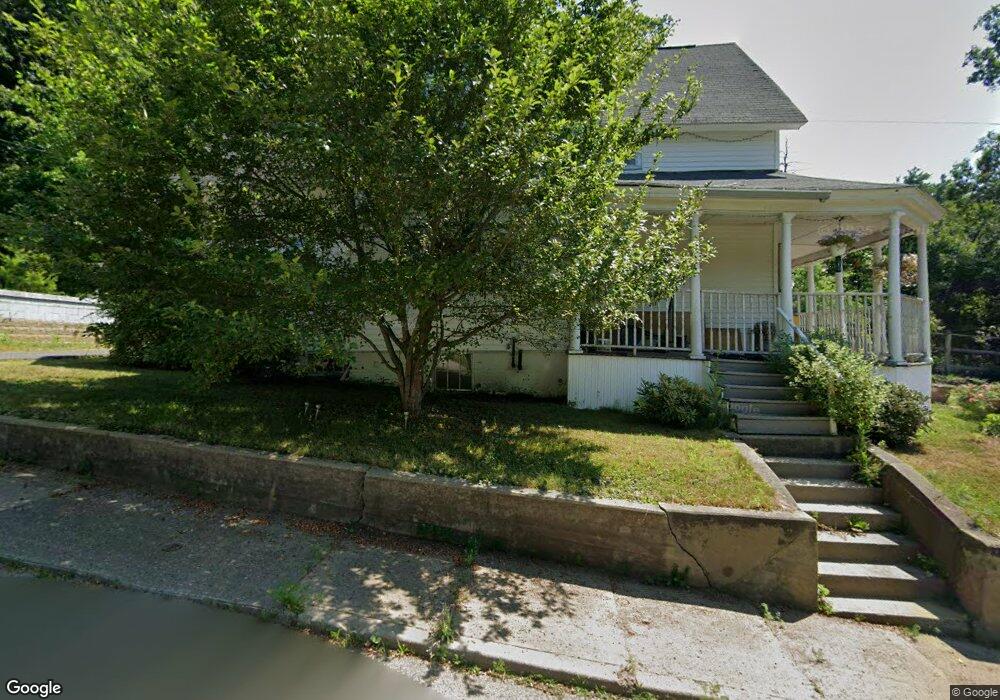
54 Ball St Orange, MA 01364
Estimated Value: $288,000 - $330,000
5
Beds
2
Baths
2,019
Sq Ft
$157/Sq Ft
Est. Value
About This Home
This home is located at 54 Ball St, Orange, MA 01364 and is currently estimated at $316,671, approximately $156 per square foot. 54 Ball St is a home located in Franklin County with nearby schools including Fisher Hill and Ralph C Mahar Regional School.
Ownership History
Date
Name
Owned For
Owner Type
Purchase Details
Closed on
May 22, 2009
Sold by
Pellerin Edward and Stlouis Cecile
Bought by
Pellerin Edward and Stlouis Cecile
Current Estimated Value
Purchase Details
Closed on
May 6, 2009
Sold by
Pellerin Edward and Stlouis Cecile
Bought by
Pellerin Edward and Stlouis Cecile
Purchase Details
Closed on
Jan 18, 2008
Sold by
Stone Richard C and Stone Linda M
Bought by
Pellerin Edward and Stlouis Cecile F
Home Financials for this Owner
Home Financials are based on the most recent Mortgage that was taken out on this home.
Original Mortgage
$171,500
Interest Rate
6.02%
Mortgage Type
Purchase Money Mortgage
Create a Home Valuation Report for This Property
The Home Valuation Report is an in-depth analysis detailing your home's value as well as a comparison with similar homes in the area
Home Values in the Area
Average Home Value in this Area
Purchase History
| Date | Buyer | Sale Price | Title Company |
|---|---|---|---|
| Pellerin Edward | -- | -- | |
| Pellerin Edward | -- | -- | |
| Pellerin Edward | $171,500 | -- |
Source: Public Records
Mortgage History
| Date | Status | Borrower | Loan Amount |
|---|---|---|---|
| Previous Owner | Pellerin Edward | $171,500 |
Source: Public Records
Tax History
| Year | Tax Paid | Tax Assessment Tax Assessment Total Assessment is a certain percentage of the fair market value that is determined by local assessors to be the total taxable value of land and additions on the property. | Land | Improvement |
|---|---|---|---|---|
| 2025 | $43 | $263,500 | $28,700 | $234,800 |
| 2024 | $3,999 | $229,300 | $28,700 | $200,600 |
| 2023 | $3,601 | $200,500 | $25,800 | $174,700 |
| 2022 | $3,283 | $171,700 | $25,800 | $145,900 |
| 2021 | $3,264 | $162,800 | $44,700 | $118,100 |
| 2020 | $3,113 | $153,100 | $40,800 | $112,300 |
| 2019 | $3,065 | $136,100 | $35,300 | $100,800 |
| 2018 | $2,738 | $124,800 | $32,900 | $91,900 |
| 2017 | $2,650 | $124,800 | $32,900 | $91,900 |
| 2016 | $2,487 | $114,600 | $29,400 | $85,200 |
| 2015 | $2,488 | $119,800 | $31,400 | $88,400 |
| 2014 | $2,548 | $129,100 | $31,400 | $97,700 |
Source: Public Records
Map
Nearby Homes
- 35 Ball St
- 36 Summit St Unit A
- 36 Summit St Unit B
- 30 Cottage St
- 166-168 W Main St
- 56 Shelter St
- 12-14 E Main St
- 50 E Main St
- 58 E Main St
- 222 W River St
- 49 Lincoln Ave
- 23 E Howe St
- 270 S Main St
- 313-315 Walnut Hill Rd
- 490 S Main St
- 216 Holtshire Rd
- 549 E Main St
- 00 S Main St
- 000 S Main St
- 246 Holtshire Rd Unit Lot 3
Your Personal Tour Guide
Ask me questions while you tour the home.