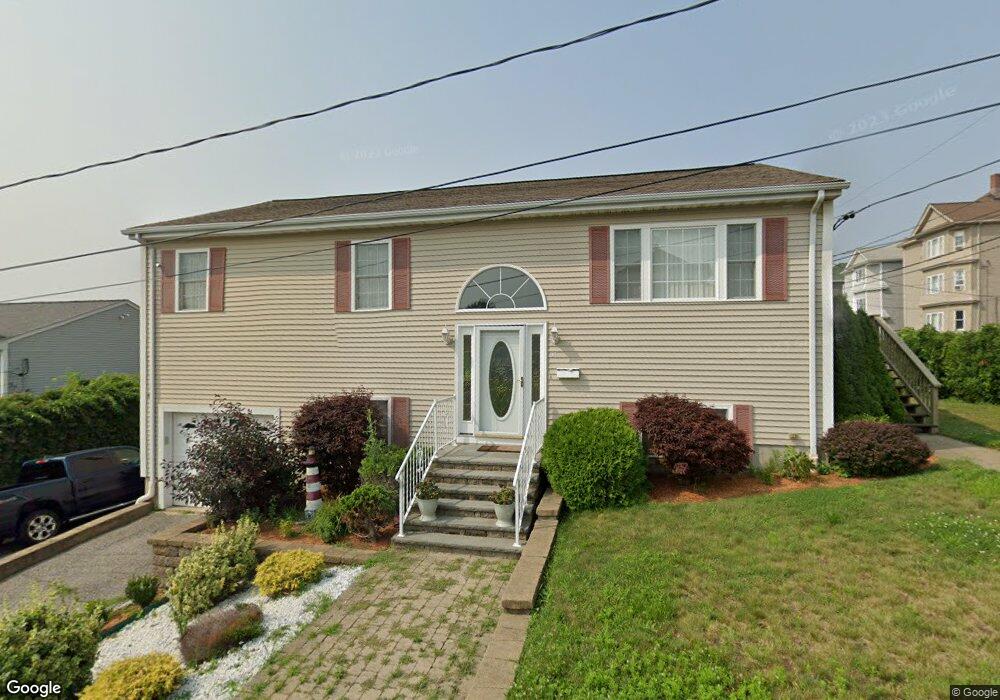
54 Barker St Fall River, MA 02724
Sandy Beach NeighborhoodEstimated Value: $460,000 - $493,392
3
Beds
3
Baths
2,038
Sq Ft
$235/Sq Ft
Est. Value
About This Home
This home is located at 54 Barker St, Fall River, MA 02724 and is currently estimated at $478,848, approximately $234 per square foot. 54 Barker St is a home located in Bristol County with nearby schools including Carlton M. Viveiros Elementary School, Matthew J. Kuss Middle School, and B M C Durfee High School.
Ownership History
Date
Name
Owned For
Owner Type
Purchase Details
Closed on
Apr 1, 2005
Sold by
Corga Albert and Alves Joseph
Bought by
Pavao Johnny M and Pavao Lisa C
Current Estimated Value
Home Financials for this Owner
Home Financials are based on the most recent Mortgage that was taken out on this home.
Original Mortgage
$51,980
Interest Rate
5.61%
Mortgage Type
Purchase Money Mortgage
Purchase Details
Closed on
Oct 2, 2002
Sold by
Chaves Maria C
Bought by
Corga Albert and Alves Joseph
Create a Home Valuation Report for This Property
The Home Valuation Report is an in-depth analysis detailing your home's value as well as a comparison with similar homes in the area
Home Values in the Area
Average Home Value in this Area
Purchase History
| Date | Buyer | Sale Price | Title Company |
|---|---|---|---|
| Pavao Johnny M | $259,900 | -- | |
| Corga Albert | $50,000 | -- |
Source: Public Records
Mortgage History
| Date | Status | Borrower | Loan Amount |
|---|---|---|---|
| Open | Corga Albert | $231,800 | |
| Closed | Pavao Johnny M | $51,980 |
Source: Public Records
Tax History
| Year | Tax Paid | Tax Assessment Tax Assessment Total Assessment is a certain percentage of the fair market value that is determined by local assessors to be the total taxable value of land and additions on the property. | Land | Improvement |
|---|---|---|---|---|
| 2025 | $5,414 | $472,800 | $107,200 | $365,600 |
| 2024 | $4,798 | $417,600 | $103,300 | $314,300 |
| 2023 | $4,637 | $377,900 | $85,300 | $292,600 |
| 2022 | $4,028 | $319,200 | $81,300 | $237,900 |
| 2021 | $4,041 | $292,200 | $77,300 | $214,900 |
| 2020 | $3,956 | $273,800 | $76,200 | $197,600 |
| 2019 | $3,536 | $242,500 | $73,400 | $169,100 |
| 2018 | $3,449 | $235,900 | $79,500 | $156,400 |
| 2017 | $3,231 | $230,800 | $75,700 | $155,100 |
| 2016 | $3,110 | $228,200 | $80,600 | $147,600 |
| 2015 | $2,897 | $221,500 | $80,600 | $140,900 |
| 2014 | $2,756 | $219,100 | $78,200 | $140,900 |
Source: Public Records
Map
Nearby Homes
- 70 Brown St
- 700 Shore Dr Unit 6-604
- 700 Shore Dr Unit 1205
- 700 Shore Dr Unit 810
- 20 Wilcox St
- 1273-1279 S Main St
- 420 Bradford Ave
- 303 Eagle St Unit C
- 1334 S Main St
- 403 Division St Unit 13
- 403 Division St Unit 5
- 403 Division St Unit 9
- 403 Division St Unit 11
- 403 Division St Unit 12
- 403 Division St Unit 1
- 403 Division St Unit 18
- 334 Fountain St
- 330 William St
- 245 Dwelly St
- 71 Mystic St Unit 3
Your Personal Tour Guide
Ask me questions while you tour the home.