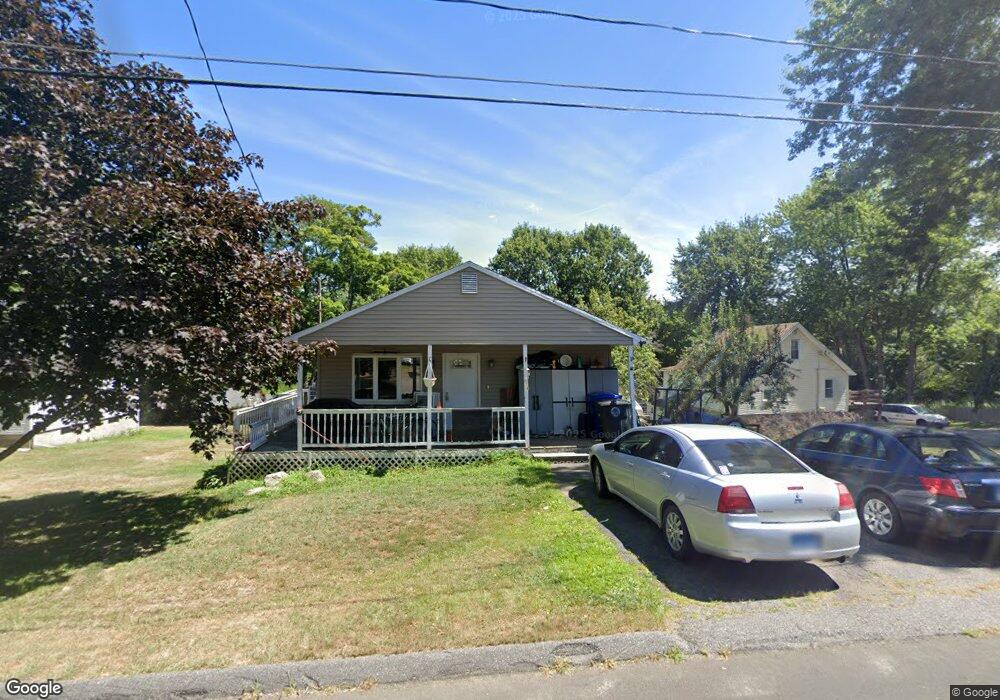
54 Birden St Torrington, CT 06790
Estimated Value: $268,000 - $296,000
3
Beds
1
Bath
1,066
Sq Ft
$264/Sq Ft
Est. Value
About This Home
This home is located at 54 Birden St, Torrington, CT 06790 and is currently estimated at $281,751, approximately $264 per square foot. 54 Birden St is a home located in Litchfield County with nearby schools including Torrington Middle School, Torrington High School, and St. John Paul the Great Academy.
Ownership History
Date
Name
Owned For
Owner Type
Purchase Details
Closed on
Nov 19, 1999
Sold by
Lopardo Thomas L and Lopardo Holly A
Bought by
Cogswell Christopher E
Current Estimated Value
Home Financials for this Owner
Home Financials are based on the most recent Mortgage that was taken out on this home.
Original Mortgage
$96,100
Interest Rate
7.76%
Create a Home Valuation Report for This Property
The Home Valuation Report is an in-depth analysis detailing your home's value as well as a comparison with similar homes in the area
Home Values in the Area
Average Home Value in this Area
Purchase History
| Date | Buyer | Sale Price | Title Company |
|---|---|---|---|
| Cogswell Christopher E | $97,500 | -- |
Source: Public Records
Mortgage History
| Date | Status | Borrower | Loan Amount |
|---|---|---|---|
| Open | Cogswell Christopher E | $117,300 | |
| Closed | Cogswell Christopher E | $96,100 | |
| Previous Owner | Cogswell Christopher E | $10,000 | |
| Previous Owner | Cogswell Christopher E | $65,000 |
Source: Public Records
Tax History Compared to Growth
Tax History
| Year | Tax Paid | Tax Assessment Tax Assessment Total Assessment is a certain percentage of the fair market value that is determined by local assessors to be the total taxable value of land and additions on the property. | Land | Improvement |
|---|---|---|---|---|
| 2025 | $6,433 | $167,300 | $23,520 | $143,780 |
| 2024 | $3,981 | $82,990 | $23,520 | $59,470 |
| 2023 | $3,980 | $82,990 | $23,520 | $59,470 |
| 2022 | $3,912 | $82,990 | $23,520 | $59,470 |
| 2021 | $3,832 | $82,990 | $23,520 | $59,470 |
| 2020 | $3,832 | $82,990 | $23,520 | $59,470 |
| 2019 | $4,152 | $89,920 | $28,890 | $61,030 |
| 2018 | $4,152 | $89,920 | $28,890 | $61,030 |
| 2017 | $4,114 | $89,920 | $28,890 | $61,030 |
| 2016 | $4,114 | $89,920 | $28,890 | $61,030 |
| 2015 | $4,114 | $89,920 | $28,890 | $61,030 |
| 2014 | $4,069 | $112,020 | $43,390 | $68,630 |
Source: Public Records
Map
Nearby Homes
- 69 Johnson St
- 0 Highland Ave Unit 24088105
- 116 Johnson St
- 49 Chestnut Ave
- 213 Spring St
- 244 Hawthorne Terrace
- 130 Oakbrook Ln
- 58 Berry St
- 146 Berry St
- 231 Beechwood Ave
- 199 Migeon Ave
- Lot 10 Westledge Dr
- 264 Allen Rd
- 149 Heights Dr
- 5 Zappulla Dr
- 152 Funston Ave
- 68 Westledge Terrace
- 375 N Elm St
- 349 Allen Rd Unit 22B
- 94 Lafayette St