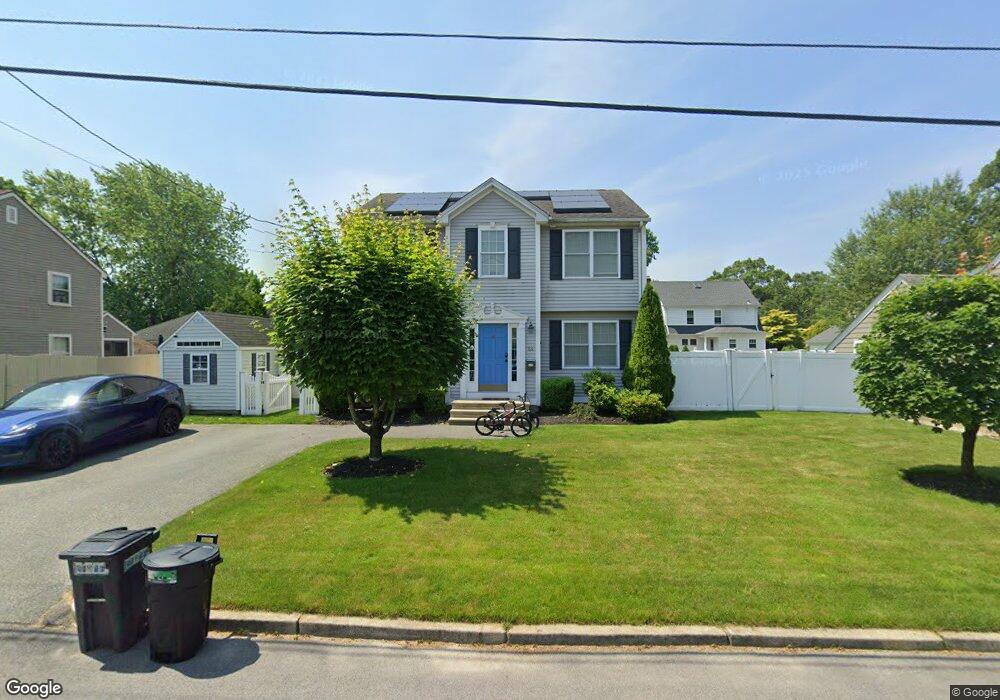
54 Bryant Rd Cranston, RI 02910
Eden Park NeighborhoodEstimated Value: $494,000 - $574,000
3
Beds
3
Baths
1,596
Sq Ft
$327/Sq Ft
Est. Value
About This Home
This home is located at 54 Bryant Rd, Cranston, RI 02910 and is currently estimated at $522,031, approximately $327 per square foot. 54 Bryant Rd is a home located in Providence County with nearby schools including Park View Middle School, Cranston High School East, and Cadence Academy Preschool - Cranston.
Ownership History
Date
Name
Owned For
Owner Type
Purchase Details
Closed on
Jan 28, 2022
Sold by
Barton Craig and Perez-Barton Martha
Bought by
Barton Craig
Current Estimated Value
Purchase Details
Closed on
Nov 24, 2010
Sold by
Greenwich Bay Homes Ll
Bought by
Barton Craig and Perez-Barton Martha
Home Financials for this Owner
Home Financials are based on the most recent Mortgage that was taken out on this home.
Original Mortgage
$150,000
Interest Rate
4.25%
Mortgage Type
Purchase Money Mortgage
Create a Home Valuation Report for This Property
The Home Valuation Report is an in-depth analysis detailing your home's value as well as a comparison with similar homes in the area
Home Values in the Area
Average Home Value in this Area
Purchase History
| Date | Buyer | Sale Price | Title Company |
|---|---|---|---|
| Barton Craig | -- | None Available | |
| Barton Craig | $254,000 | -- |
Source: Public Records
Mortgage History
| Date | Status | Borrower | Loan Amount |
|---|---|---|---|
| Previous Owner | Barton Craig | $161,975 | |
| Previous Owner | Barton Craig | $150,000 |
Source: Public Records
Tax History
| Year | Tax Paid | Tax Assessment Tax Assessment Total Assessment is a certain percentage of the fair market value that is determined by local assessors to be the total taxable value of land and additions on the property. | Land | Improvement |
|---|---|---|---|---|
| 2025 | $6,145 | $442,700 | $108,500 | $334,200 |
| 2024 | $6,025 | $442,700 | $108,500 | $334,200 |
| 2023 | $5,778 | $305,700 | $71,400 | $234,300 |
| 2022 | $5,659 | $305,700 | $71,400 | $234,300 |
| 2021 | $5,503 | $305,700 | $71,400 | $234,300 |
| 2020 | $5,361 | $258,100 | $68,000 | $190,100 |
| 2019 | $5,361 | $258,100 | $68,000 | $190,100 |
| 2018 | $5,237 | $258,100 | $68,000 | $190,100 |
| 2017 | $5,434 | $236,900 | $61,200 | $175,700 |
| 2016 | $5,105 | $227,400 | $61,200 | $166,200 |
| 2015 | $5,105 | $227,400 | $61,200 | $166,200 |
| 2014 | $4,945 | $216,500 | $61,200 | $155,300 |
Source: Public Records
Map
Nearby Homes
Your Personal Tour Guide
Ask me questions while you tour the home.