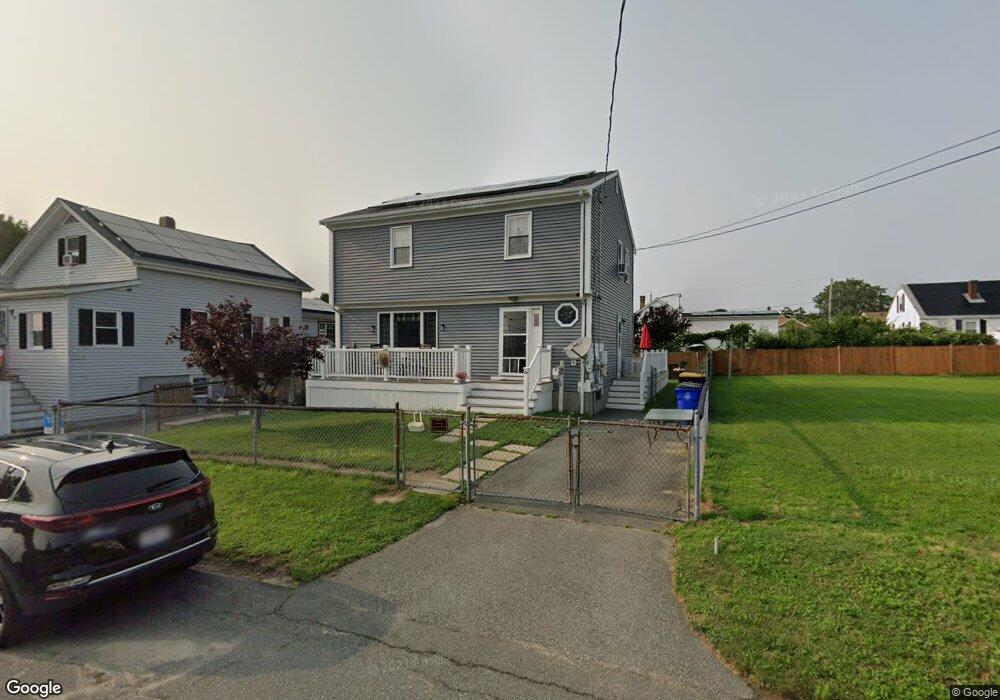
54 Byron St Fall River, MA 02724
Sandy Beach NeighborhoodEstimated Value: $409,766 - $465,000
3
Beds
2
Baths
1,710
Sq Ft
$259/Sq Ft
Est. Value
About This Home
This home is located at 54 Byron St, Fall River, MA 02724 and is currently estimated at $442,942, approximately $259 per square foot. 54 Byron St is a home located in Bristol County with nearby schools including Henry Lord Community School, B M C Durfee High School, and Argosy Collegiate Charter School.
Ownership History
Date
Name
Owned For
Owner Type
Purchase Details
Closed on
Aug 9, 1999
Sold by
Placido Frank J and Placido Susan S
Bought by
Ettress Kenneth D and Ettress Sandra L
Current Estimated Value
Home Financials for this Owner
Home Financials are based on the most recent Mortgage that was taken out on this home.
Original Mortgage
$123,437
Interest Rate
7.54%
Mortgage Type
Purchase Money Mortgage
Purchase Details
Closed on
May 19, 1989
Sold by
Fall River Const Co
Bought by
Placido Frank J
Create a Home Valuation Report for This Property
The Home Valuation Report is an in-depth analysis detailing your home's value as well as a comparison with similar homes in the area
Home Values in the Area
Average Home Value in this Area
Purchase History
| Date | Buyer | Sale Price | Title Company |
|---|---|---|---|
| Ettress Kenneth D | $123,500 | -- | |
| Placido Frank J | $154,900 | -- |
Source: Public Records
Mortgage History
| Date | Status | Borrower | Loan Amount |
|---|---|---|---|
| Open | Placido Frank J | $50,000 | |
| Open | Placido Frank J | $136,000 | |
| Closed | Placido Frank J | $123,437 | |
| Previous Owner | Placido Frank J | $129,471 |
Source: Public Records
Tax History
| Year | Tax Paid | Tax Assessment Tax Assessment Total Assessment is a certain percentage of the fair market value that is determined by local assessors to be the total taxable value of land and additions on the property. | Land | Improvement |
|---|---|---|---|---|
| 2025 | $3,426 | $299,200 | $114,300 | $184,900 |
| 2024 | $3,233 | $281,400 | $112,100 | $169,300 |
| 2023 | $3,333 | $271,600 | $101,000 | $170,600 |
| 2022 | $2,982 | $236,300 | $95,200 | $141,100 |
| 2021 | $2,861 | $206,900 | $91,000 | $115,900 |
| 2020 | $2,818 | $195,000 | $86,800 | $108,200 |
| 2019 | $2,834 | $194,400 | $90,800 | $103,600 |
| 2018 | $2,830 | $193,600 | $91,400 | $102,200 |
| 2017 | $2,684 | $191,700 | $91,400 | $100,300 |
| 2016 | $2,567 | $188,300 | $94,200 | $94,100 |
| 2015 | $2,494 | $190,700 | $94,200 | $96,500 |
| 2014 | $2,399 | $190,700 | $94,200 | $96,500 |
Source: Public Records
Map
Nearby Homes
- 24 Valley St
- 391 Clarkson St
- 579 Summit St Unit 3
- 579 Summit St Unit 2
- 30 Broad St
- 616 Woodman St
- 126 Wheeler St
- 42 Main Rd
- 2229 S Main St
- 25 Mathew Rd
- 245 Dwelly St
- 29 Robert St
- 609 King Philip St
- 15 Higgins St
- 57 Larouche St
- 1852 S Main St
- 1846 S Main St
- 12 Horizon Dr
- 347 Main Rd Unit 103
- 359 Main Rd
Your Personal Tour Guide
Ask me questions while you tour the home.