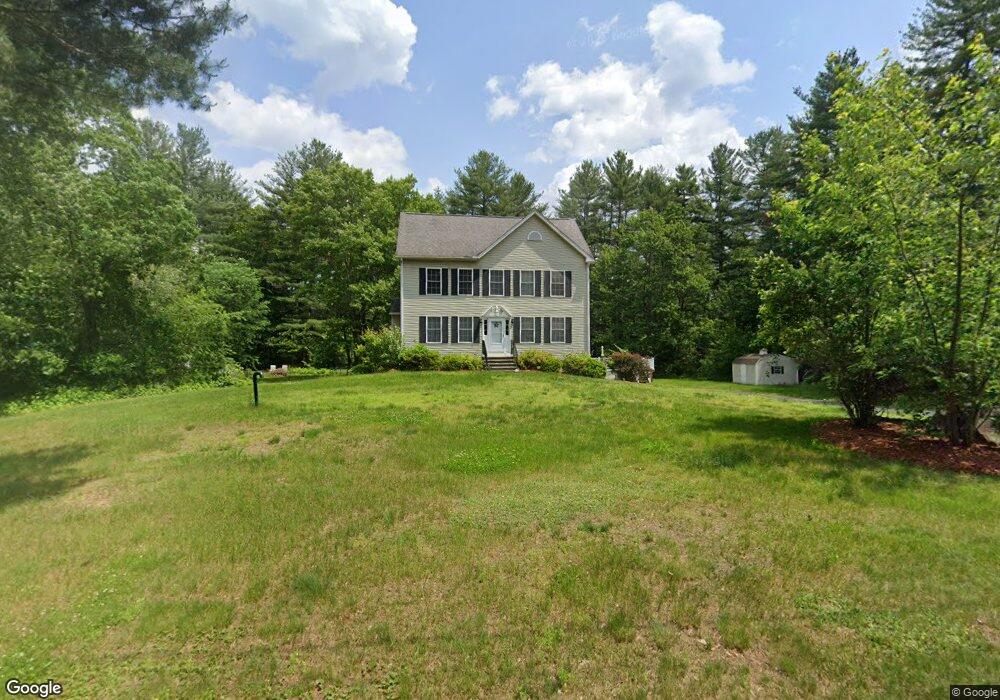
54 Chase Rd Londonderry, NH 03053
Estimated Value: $595,000 - $762,000
3
Beds
3
Baths
1,872
Sq Ft
$357/Sq Ft
Est. Value
About This Home
This home is located at 54 Chase Rd, Londonderry, NH 03053 and is currently estimated at $667,898, approximately $356 per square foot. 54 Chase Rd is a home located in Rockingham County with nearby schools including Londonderry Middle School and Londonderry Senior High School.
Ownership History
Date
Name
Owned For
Owner Type
Purchase Details
Closed on
Aug 2, 2011
Sold by
Gray Richard S and Gray Lianne M
Bought by
Willwerth Thomas K and Willwerth Beth A
Current Estimated Value
Home Financials for this Owner
Home Financials are based on the most recent Mortgage that was taken out on this home.
Original Mortgage
$259,250
Outstanding Balance
$179,083
Interest Rate
4.52%
Mortgage Type
Purchase Money Mortgage
Estimated Equity
$488,815
Purchase Details
Closed on
Aug 1, 2005
Sold by
Baker Mark
Bought by
Gray Richard S and Gray Lianne M
Home Financials for this Owner
Home Financials are based on the most recent Mortgage that was taken out on this home.
Original Mortgage
$299,500
Interest Rate
5.67%
Mortgage Type
Purchase Money Mortgage
Purchase Details
Closed on
Dec 10, 2004
Sold by
Cooper Financial Llc
Bought by
Baker Mark
Purchase Details
Closed on
Oct 5, 2004
Sold by
Cook Gloria
Bought by
Cooper Financial Llc
Create a Home Valuation Report for This Property
The Home Valuation Report is an in-depth analysis detailing your home's value as well as a comparison with similar homes in the area
Home Values in the Area
Average Home Value in this Area
Purchase History
| Date | Buyer | Sale Price | Title Company |
|---|---|---|---|
| Willwerth Thomas K | $305,000 | -- | |
| Gray Richard S | $374,500 | -- | |
| Baker Mark | $137,000 | -- | |
| Cooper Financial Llc | $125,000 | -- |
Source: Public Records
Mortgage History
| Date | Status | Borrower | Loan Amount |
|---|---|---|---|
| Open | Cooper Financial Llc | $259,250 | |
| Previous Owner | Cooper Financial Llc | $299,500 |
Source: Public Records
Tax History Compared to Growth
Tax History
| Year | Tax Paid | Tax Assessment Tax Assessment Total Assessment is a certain percentage of the fair market value that is determined by local assessors to be the total taxable value of land and additions on the property. | Land | Improvement |
|---|---|---|---|---|
| 2024 | $8,507 | $527,100 | $184,600 | $342,500 |
| 2023 | $8,249 | $527,100 | $184,600 | $342,500 |
| 2022 | $7,839 | $424,200 | $138,700 | $285,500 |
| 2021 | $7,797 | $424,200 | $138,700 | $285,500 |
| 2020 | $7,642 | $380,000 | $114,700 | $265,300 |
| 2019 | $7,368 | $380,000 | $114,700 | $265,300 |
| 2018 | $6,956 | $319,100 | $96,000 | $223,100 |
| 2017 | $5,669 | $319,100 | $96,000 | $223,100 |
| 2016 | $6,764 | $319,100 | $96,000 | $223,100 |
| 2015 | $6,707 | $319,100 | $96,000 | $223,100 |
| 2014 | $6,730 | $319,100 | $96,000 | $223,100 |
| 2011 | -- | $322,600 | $96,000 | $226,600 |
Source: Public Records
Map
Nearby Homes
- 97 Kendall Pond Rd
- 1 Westwood Dr
- 69 Oakridge Dr
- 87 Oakridge Dr
- 24 Griffin Rd
- 34 Pleasant Dr
- 33 Griffin Rd
- 4 Elijah Hill Ln
- Lot 5 Plan at Highclere
- 149 Londonderry Rd
- 171 Londonderry Rd
- 7 Buckhide Rd
- 2 2nd St
- 11 Park St
- 18 Hawthorne Rd
- 7 Oakwood St
- 19 David Dr
- 439 Pendleton Ln
- 13 Gertrude Rd
- 21 Griffin Rd