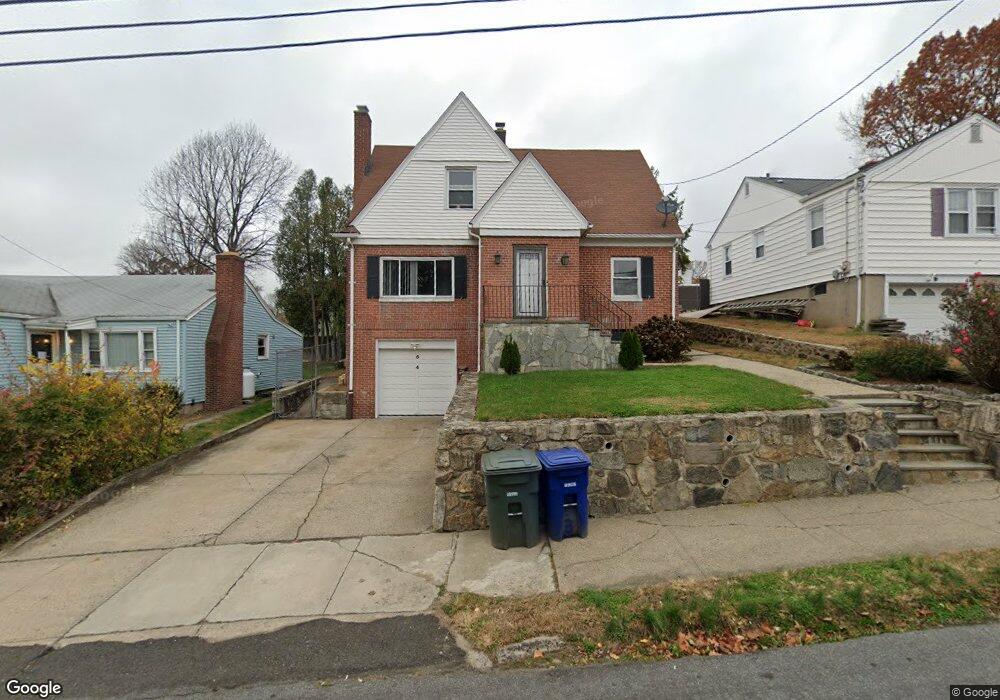
54 Clark St Bridgeport, CT 06606
North End NeighborhoodEstimated Value: $403,000 - $527,000
3
Beds
2
Baths
2,170
Sq Ft
$209/Sq Ft
Est. Value
About This Home
This home is located at 54 Clark St, Bridgeport, CT 06606 and is currently estimated at $454,367, approximately $209 per square foot. 54 Clark St is a home located in Fairfield County with nearby schools including Blackham School, Central High School, and St Andrew School.
Ownership History
Date
Name
Owned For
Owner Type
Purchase Details
Closed on
Feb 25, 2022
Sold by
Castro Adriano
Bought by
Castro Adrian and Hidalgo Norma
Current Estimated Value
Purchase Details
Closed on
Apr 4, 2006
Sold by
Jenkins Dareen
Bought by
Castro Vilma and Castro Adriano
Home Financials for this Owner
Home Financials are based on the most recent Mortgage that was taken out on this home.
Original Mortgage
$248,000
Interest Rate
7.97%
Purchase Details
Closed on
Dec 2, 2004
Sold by
Moore Patricia
Bought by
Jenkins Dareen
Home Financials for this Owner
Home Financials are based on the most recent Mortgage that was taken out on this home.
Original Mortgage
$212,000
Interest Rate
5.69%
Purchase Details
Closed on
Mar 22, 1995
Sold by
Dicambillo Domonic A and Dicambillo Charlotte
Bought by
Moore William and Moore Cynthia
Create a Home Valuation Report for This Property
The Home Valuation Report is an in-depth analysis detailing your home's value as well as a comparison with similar homes in the area
Home Values in the Area
Average Home Value in this Area
Purchase History
| Date | Buyer | Sale Price | Title Company |
|---|---|---|---|
| Castro Adrian | -- | None Available | |
| Castro Adrian | -- | None Available | |
| Castro Vilma | $310,000 | -- | |
| Castro Vilma | $310,000 | -- | |
| Jenkins Dareen | $265,000 | -- | |
| Jenkins Dareen | $265,000 | -- | |
| Moore William | $132,500 | -- | |
| Moore William | $132,500 | -- |
Source: Public Records
Mortgage History
| Date | Status | Borrower | Loan Amount |
|---|---|---|---|
| Previous Owner | Moore William | $248,000 | |
| Previous Owner | Moore William | $212,000 |
Source: Public Records
Tax History
| Year | Tax Paid | Tax Assessment Tax Assessment Total Assessment is a certain percentage of the fair market value that is determined by local assessors to be the total taxable value of land and additions on the property. | Land | Improvement |
|---|---|---|---|---|
| 2025 | $7,977 | $183,580 | $75,310 | $108,270 |
| 2024 | $7,977 | $183,580 | $75,310 | $108,270 |
| 2023 | $7,977 | $183,580 | $75,310 | $108,270 |
| 2022 | $7,977 | $183,580 | $75,310 | $108,270 |
| 2021 | $7,977 | $183,580 | $75,310 | $108,270 |
| 2020 | $7,135 | $132,150 | $41,310 | $90,840 |
| 2019 | $7,135 | $132,150 | $41,310 | $90,840 |
| 2018 | $7,185 | $132,150 | $41,310 | $90,840 |
| 2017 | $7,185 | $132,150 | $41,310 | $90,840 |
| 2016 | $7,185 | $132,150 | $41,310 | $90,840 |
| 2015 | $7,545 | $178,790 | $49,980 | $128,810 |
| 2014 | $7,545 | $178,790 | $49,980 | $128,810 |
Source: Public Records
Map
Nearby Homes
- 3461 Main St
- 120 Clark St
- 578 Beechmont Ave
- 45 Stevens St Unit 3L
- 1095 Wayne St
- 315 Tesiny Ave
- 240 Valley Ave
- 355 Exeter St
- 213 Exeter St
- 219 Exeter St
- 1265 Lindley St
- 420 Greenwood St
- 234 Savoy St
- 95 Savoy St
- 339 Goldenrod Ave
- 316 Goldenrod Ave
- 26 Marsdale Ave
- 457 Summit St
- 25 Westfield Ave
- 70 Pleasantview Ave
Your Personal Tour Guide
Ask me questions while you tour the home.