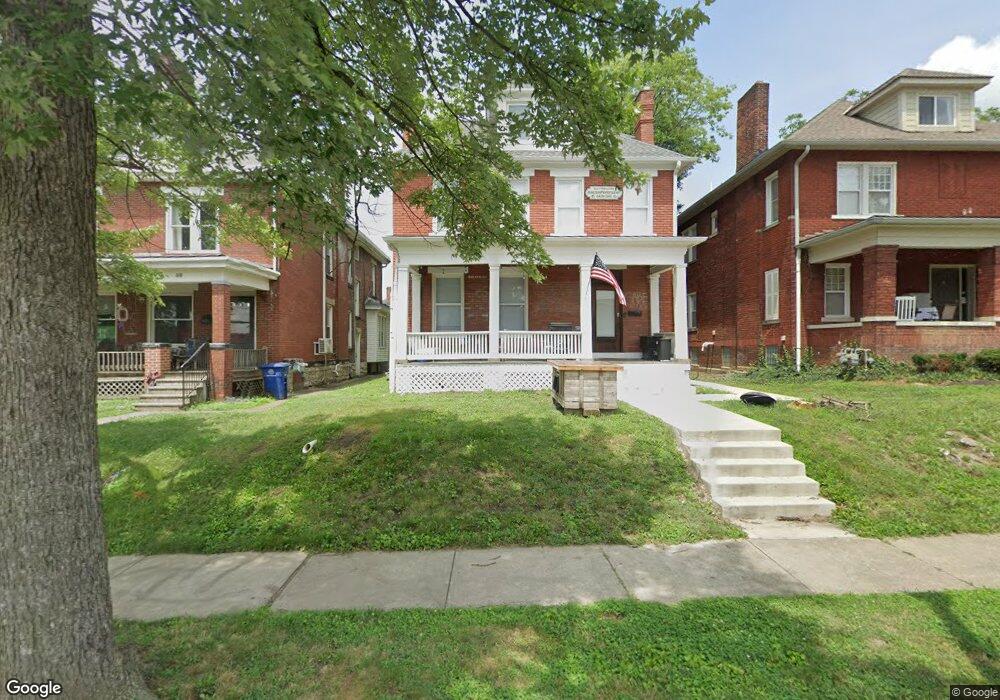
54 E 18th Ave Columbus, OH 43201
Estimated Value: $399,740
6
Beds
2
Baths
2,373
Sq Ft
$168/Sq Ft
Est. Value
About This Home
This home is located at 54 E 18th Ave, Columbus, OH 43201 and is currently estimated at $399,740, approximately $168 per square foot. 54 E 18th Ave is a home located in Franklin County with nearby schools including Weinland Park Elementary School, Dominion Middle School, and Whetstone High School.
Ownership History
Date
Name
Owned For
Owner Type
Purchase Details
Closed on
Apr 28, 2021
Sold by
University Manors I Llc
Bought by
Hnb University Manors I Llc
Current Estimated Value
Purchase Details
Closed on
May 26, 1999
Sold by
Goodrich James W
Bought by
University Manors Ltd
Home Financials for this Owner
Home Financials are based on the most recent Mortgage that was taken out on this home.
Original Mortgage
$112,000
Outstanding Balance
$26,920
Interest Rate
6.92%
Mortgage Type
Commercial
Estimated Equity
$372,820
Purchase Details
Closed on
May 1, 1985
Create a Home Valuation Report for This Property
The Home Valuation Report is an in-depth analysis detailing your home's value as well as a comparison with similar homes in the area
Purchase History
| Date | Buyer | Sale Price | Title Company |
|---|---|---|---|
| Hnb University Manors I Llc | -- | Landsel Title Agency Inc | |
| University Manors Ltd | $140,000 | Amerititle Agency Inc | |
| -- | $66,800 | -- |
Source: Public Records
Mortgage History
| Date | Status | Borrower | Loan Amount |
|---|---|---|---|
| Open | University Manors Ltd | $112,000 |
Source: Public Records
Tax History
| Year | Tax Paid | Tax Assessment Tax Assessment Total Assessment is a certain percentage of the fair market value that is determined by local assessors to be the total taxable value of land and additions on the property. | Land | Improvement |
|---|---|---|---|---|
| 2025 | $6,132 | $82,610 | $27,900 | $54,710 |
| 2024 | $6,132 | $82,610 | $27,900 | $54,710 |
| 2023 | $6,035 | $82,610 | $27,900 | $54,710 |
| 2022 | $6,693 | $89,250 | $22,330 | $66,920 |
| 2021 | $6,722 | $89,250 | $22,330 | $66,920 |
| 2020 | $6,676 | $89,250 | $22,330 | $66,920 |
| 2019 | $7,351 | $89,250 | $22,330 | $66,920 |
| 2018 | $6,767 | $89,250 | $22,330 | $66,920 |
| 2017 | $7,014 | $89,250 | $22,330 | $66,920 |
| 2016 | $6,686 | $76,830 | $22,330 | $54,500 |
| 2015 | $6,208 | $76,830 | $22,330 | $54,500 |
| 2014 | $6,205 | $76,830 | $22,330 | $54,500 |
| 2013 | $3,074 | $76,825 | $22,330 | $54,495 |
Source: Public Records
Map
Nearby Homes
- 9 E Norwich Ave Unit 15
- 1777 Summit St
- 335 E 18th Ave Unit 333
- 288 E 14th Ave
- 1988 1990 N 4th St
- 76 Chittenden Ave
- 384 E 17th Ave
- 2082 N 4th St
- 445 E 16th Ave
- 408 E 14th Ave
- 2210-2212 N 4th St
- 2394 Neil Ave
- 6 E Blake Ave
- 2362 Indiana Ave
- 2295 N 4th St
- 497 E Oakland Ave
- 2395 Summit St Unit 397
- 2458- 2458 1 2 Deming Ave
- 27 W 8th Ave
- 102 W Tompkins St
- 48 E 18th Ave Unit 50
- 44 E 18th Ave Unit 46
- 44 E 18th Ave Unit 44-46
- 44 E 18th Ave
- 38 E 18th Ave Unit 40
- 70 E 18th Ave
- 49 E 18th Ave
- 61 E Woodruff Ave Unit 63
- 65 E Woodruff Ave Unit 67
- 76 E 18th Ave
- 63 E 18th Ave
- 55 E Woodruff Ave
- 71 E Woodruff Ave
- 30 E 18th Ave
- 47 E Woodruff Ave
- 51 E Woodruff Ave
- 28 E 18th Ave
- 82 E 18th Ave
- 39 E 18th Ave
- 41 E Woodruff Ave Unit 43
Your Personal Tour Guide
Ask me questions while you tour the home.