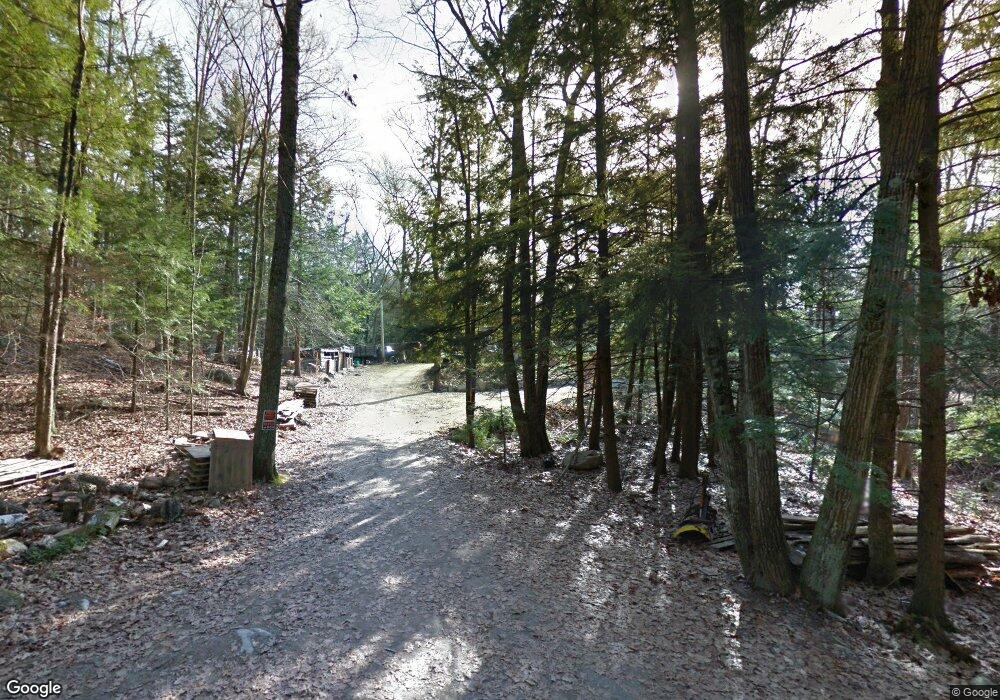
54 Falls Rd Deering, NH 03244
Estimated Value: $324,000 - $380,000
2
Beds
1
Bath
928
Sq Ft
$375/Sq Ft
Est. Value
About This Home
This home is located at 54 Falls Rd, Deering, NH 03244 and is currently estimated at $348,200, approximately $375 per square foot. 54 Falls Rd is a home located in Hillsborough County with nearby schools including Hillsboro-Deering Elementary School and Hillsboro-Deering High School.
Ownership History
Date
Name
Owned For
Owner Type
Purchase Details
Closed on
Apr 10, 2019
Sold by
Gallo Frank and Torrisi Jeffrey
Bought by
Areias Paul M and Areias Laura B
Current Estimated Value
Purchase Details
Closed on
Jan 2, 2013
Sold by
Deering Town Of
Bought by
Areias Paul and Areias Laura
Home Financials for this Owner
Home Financials are based on the most recent Mortgage that was taken out on this home.
Original Mortgage
$70,000
Interest Rate
3.44%
Mortgage Type
New Conventional
Purchase Details
Closed on
Dec 18, 2012
Sold by
Areias Paul and Areias Laura
Bought by
Areias Laura B and Areias Paul M
Home Financials for this Owner
Home Financials are based on the most recent Mortgage that was taken out on this home.
Original Mortgage
$70,000
Interest Rate
3.44%
Mortgage Type
New Conventional
Purchase Details
Closed on
Nov 9, 2010
Sold by
Fhlmc
Bought by
Areias Paul and Areias Laura
Purchase Details
Closed on
Apr 9, 2010
Sold by
Lemire James P and Taylor Bean
Bought by
Fhlmc
Create a Home Valuation Report for This Property
The Home Valuation Report is an in-depth analysis detailing your home's value as well as a comparison with similar homes in the area
Home Values in the Area
Average Home Value in this Area
Purchase History
| Date | Buyer | Sale Price | Title Company |
|---|---|---|---|
| Areias Paul M | $10,000 | -- | |
| Areias Paul | -- | -- | |
| Areias Laura B | -- | -- | |
| Areias Paul | $33,600 | -- | |
| Fhlmc | $94,900 | -- |
Source: Public Records
Mortgage History
| Date | Status | Borrower | Loan Amount |
|---|---|---|---|
| Previous Owner | Areias Laura B | $70,000 | |
| Previous Owner | Fhlmc | $137,600 | |
| Previous Owner | Fhlmc | $38,700 |
Source: Public Records
Tax History
| Year | Tax Paid | Tax Assessment Tax Assessment Total Assessment is a certain percentage of the fair market value that is determined by local assessors to be the total taxable value of land and additions on the property. | Land | Improvement |
|---|---|---|---|---|
| 2025 | $4,930 | $284,000 | $114,500 | $169,500 |
| 2024 | $4,982 | $177,300 | $71,200 | $106,100 |
| 2023 | $4,606 | $177,300 | $71,200 | $106,100 |
| 2022 | $4,034 | $177,300 | $71,200 | $106,100 |
| 2021 | $4,000 | $177,300 | $71,200 | $106,100 |
| 2020 | $4,399 | $177,300 | $71,200 | $106,100 |
| 2019 | $4,593 | $150,000 | $60,800 | $89,200 |
| 2018 | $4,508 | $150,000 | $60,800 | $89,200 |
| 2017 | $4,496 | $150,000 | $60,800 | $89,200 |
| 2016 | $4,174 | $146,200 | $60,800 | $85,400 |
| 2015 | $4,288 | $145,000 | $60,800 | $84,200 |
| 2014 | $3,947 | $160,000 | $68,400 | $91,600 |
| 2013 | $3,835 | $147,800 | $68,400 | $79,400 |
Source: Public Records
Map
Nearby Homes
- 155 Gillis Hill Rd
- 22 Merrill Dr
- 60 Pine Meadows Cir
- 12 Thompson Crossing Unit 231-1-1
- 222-3 Fisher Rd
- 126 Fisher Rd
- 008-043-001 School House Rd
- 008-043-000 School House Rd
- 29 N Main St
- 9 Reservoir Rd
- 13 Elm St
- 185 Larkin Hill Rd
- 00 Rochester Rd Unit 32
- 184 Francestown Rd
- 13 Acadia Ave
- Lot 7-13 Mountain Rd
- 0 Bridle Path Rd
- 10 Old Stagecoach Rd
- 44 Buttercup Ln
- 120 Deering Center Rd
- 2498 2nd New Hampshire Turnpike N
- 36 Falls Rd
- 42 Falls Rd
- 158 Falls Rd
- 58 Falls Rd
- 16 Falls Rd
- 2572 2nd Nh Turnpike
- 2572 2nd Nh Turnpike
- 2572 2nd Nh Turnpike
- 2542 2nd Nh Turnpike
- 2542 2nd Nh Turnpike
- 2552 2nd Nh Turnpike
- 2592 2nd Nh Turnpike
- 2592 2nd Nh Turnpike
- 2600 2nd Nh Turnpike
- 2600 2nd Nh Turnpike
- 2602 2nd Nh Turnpike
- 2526 2nd Nh Turnpike
- 2607 2nd Nh Turnpike
- 2510 2nd Nh Turnpike
Your Personal Tour Guide
Ask me questions while you tour the home.