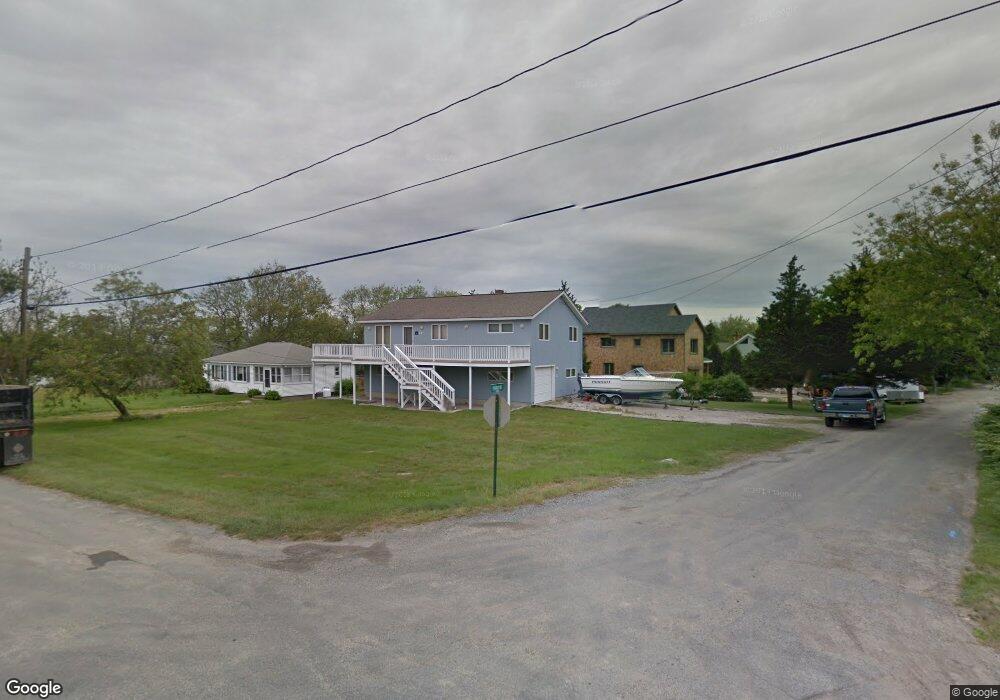
54 Fenway Road Extension Westerly, RI 02891
Estimated Value: $1,275,000 - $2,239,000
3
Beds
2
Baths
1,092
Sq Ft
$1,491/Sq Ft
Est. Value
About This Home
This home is located at 54 Fenway Road Extension, Westerly, RI 02891 and is currently estimated at $1,628,512, approximately $1,491 per square foot. 54 Fenway Road Extension is a home located in Washington County with nearby schools including Westerly High School.
Ownership History
Date
Name
Owned For
Owner Type
Purchase Details
Closed on
Dec 23, 2014
Sold by
Fitzpatrick Margaret B
Bought by
Brennan John T and Brennan Lisa H
Current Estimated Value
Purchase Details
Closed on
Sep 28, 2007
Sold by
Dowd Susan C and Sweeney Constance A
Bought by
Mara James M and Mara Jane K
Home Financials for this Owner
Home Financials are based on the most recent Mortgage that was taken out on this home.
Original Mortgage
$520,000
Interest Rate
6.65%
Mortgage Type
Purchase Money Mortgage
Create a Home Valuation Report for This Property
The Home Valuation Report is an in-depth analysis detailing your home's value as well as a comparison with similar homes in the area
Home Values in the Area
Average Home Value in this Area
Purchase History
| Date | Buyer | Sale Price | Title Company |
|---|---|---|---|
| Brennan John T | $210,000 | -- | |
| Brennan John T | $210,000 | -- | |
| Mara James M | $650,000 | -- |
Source: Public Records
Mortgage History
| Date | Status | Borrower | Loan Amount |
|---|---|---|---|
| Previous Owner | Mara James M | $520,000 |
Source: Public Records
Tax History Compared to Growth
Tax History
| Year | Tax Paid | Tax Assessment Tax Assessment Total Assessment is a certain percentage of the fair market value that is determined by local assessors to be the total taxable value of land and additions on the property. | Land | Improvement |
|---|---|---|---|---|
| 2025 | $9,546 | $1,342,600 | $1,072,700 | $269,900 |
| 2024 | $9,756 | $994,500 | $766,200 | $228,300 |
| 2023 | $9,567 | $994,500 | $766,200 | $228,300 |
| 2022 | $9,507 | $994,500 | $766,200 | $228,300 |
| 2021 | $8,774 | $761,600 | $589,500 | $172,100 |
| 2020 | $8,614 | $761,600 | $589,500 | $172,100 |
| 2019 | $9,966 | $889,800 | $717,700 | $172,100 |
| 2018 | $10,160 | $855,200 | $717,700 | $137,500 |
| 2017 | $9,912 | $855,200 | $717,700 | $137,500 |
| 2016 | $9,989 | $855,200 | $717,700 | $137,500 |
| 2015 | $9,583 | $885,700 | $732,500 | $153,200 |
| 2014 | $9,424 | $885,700 | $732,500 | $153,200 |
Source: Public Records
Map
Nearby Homes
- 15 Breach Dr
- 22 Breach Dr
- 7 Fenway Rd
- 43 Noyes Neck Rd
- 597 Atlantic Ave
- 30 Clifford Dr
- 2 Belle Rose Dr Unit A
- 470 Atlantic Ave
- 14 Piezzo Dr
- 33 Stuart St
- 446 Atlantic Ave
- 17 Plateau Rd
- 432 Atlantic Ave
- 342 Post Rd
- 5 Robin Hollow Ln
- 346 Post Rd
- 35 Robin Hollow Ln
- 54 Sherwood Dr
- 137 Cove Point Rd E
- 853 W Beach Rd