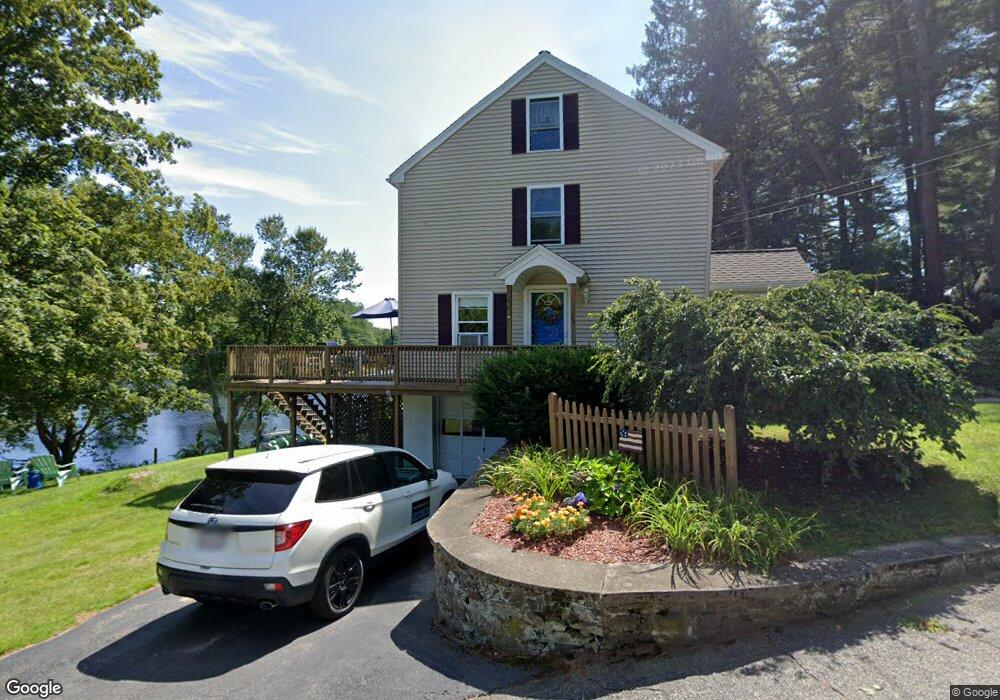
54 Forest St Oxford, MA 01540
Estimated Value: $410,000 - $446,000
4
Beds
2
Baths
1,776
Sq Ft
$242/Sq Ft
Est. Value
About This Home
This home is located at 54 Forest St, Oxford, MA 01540 and is currently estimated at $429,225, approximately $241 per square foot. 54 Forest St is a home located in Worcester County with nearby schools including Oxford High School, Alfred M Chaffee, and Clara Barton Elementary School.
Ownership History
Date
Name
Owned For
Owner Type
Purchase Details
Closed on
May 30, 1997
Sold by
Bennett Richard A and Bennett Janet J
Bought by
Durant Keith E and Durant Maria
Current Estimated Value
Home Financials for this Owner
Home Financials are based on the most recent Mortgage that was taken out on this home.
Original Mortgage
$86,757
Interest Rate
8.09%
Mortgage Type
Purchase Money Mortgage
Create a Home Valuation Report for This Property
The Home Valuation Report is an in-depth analysis detailing your home's value as well as a comparison with similar homes in the area
Home Values in the Area
Average Home Value in this Area
Purchase History
| Date | Buyer | Sale Price | Title Company |
|---|---|---|---|
| Durant Keith E | $88,000 | -- |
Source: Public Records
Mortgage History
| Date | Status | Borrower | Loan Amount |
|---|---|---|---|
| Open | Durant Keith E | $175,950 | |
| Closed | Durant Keith E | $190,000 | |
| Closed | Durant Keith E | $44,800 | |
| Closed | Durant Keith E | $86,757 |
Source: Public Records
Tax History
| Year | Tax Paid | Tax Assessment Tax Assessment Total Assessment is a certain percentage of the fair market value that is determined by local assessors to be the total taxable value of land and additions on the property. | Land | Improvement |
|---|---|---|---|---|
| 2025 | $47 | $367,400 | $85,200 | $282,200 |
| 2024 | $4,575 | $339,400 | $79,100 | $260,300 |
| 2023 | $4,728 | $346,600 | $77,700 | $268,900 |
| 2022 | $4,598 | $284,500 | $63,600 | $220,900 |
| 2021 | $4,288 | $259,400 | $60,400 | $199,000 |
| 2020 | $3,968 | $238,200 | $60,400 | $177,800 |
| 2019 | $3,716 | $218,200 | $60,500 | $157,700 |
| 2018 | $3,768 | $218,200 | $60,500 | $157,700 |
| 2017 | $3,990 | $236,800 | $72,600 | $164,200 |
| 2016 | $4,009 | $236,800 | $72,600 | $164,200 |
| 2015 | $3,739 | $236,800 | $72,600 | $164,200 |
| 2014 | $3,681 | $245,400 | $72,600 | $172,800 |
Source: Public Records
Map
Nearby Homes
Your Personal Tour Guide
Ask me questions while you tour the home.