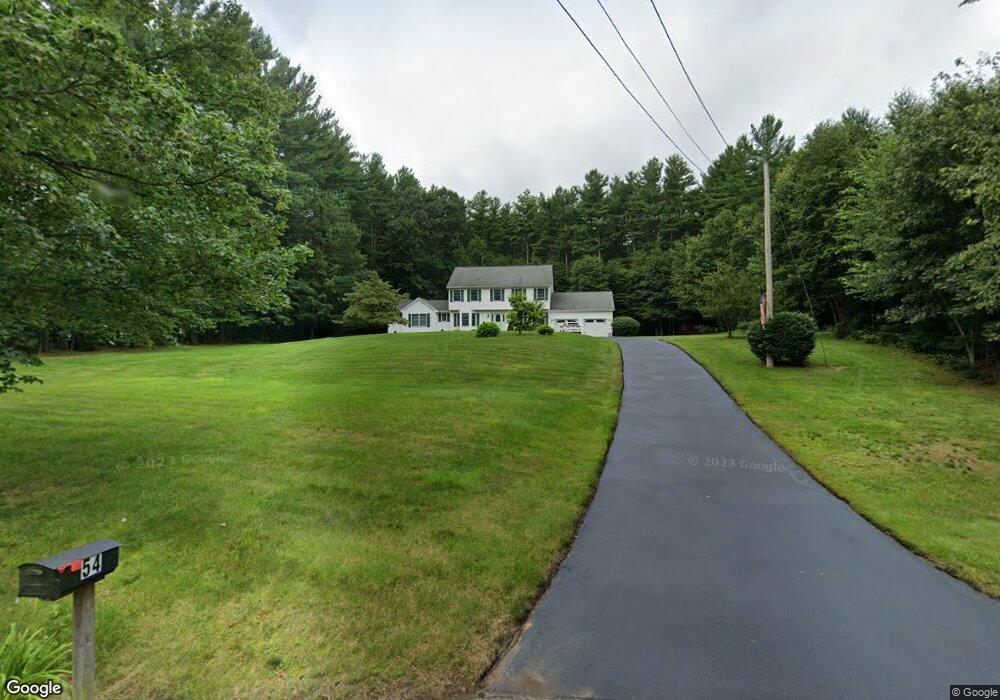
54 Grove St Douglas, MA 01516
Estimated Value: $643,000 - $740,000
5
Beds
4
Baths
2,576
Sq Ft
$269/Sq Ft
Est. Value
About This Home
This home is located at 54 Grove St, Douglas, MA 01516 and is currently estimated at $692,184, approximately $268 per square foot. 54 Grove St is a home located in Worcester County with nearby schools including Douglas Primary School, Douglas Middle School, and Douglas High School.
Ownership History
Date
Name
Owned For
Owner Type
Purchase Details
Closed on
Jun 11, 1997
Sold by
344 Providence Rd Rt and Wunschel Richard J
Bought by
Greeno Peter D and Greeno Kathleen
Current Estimated Value
Purchase Details
Closed on
Dec 20, 1996
Sold by
Beckham Beatrice A and Dutram Susan
Bought by
344 Providence Rd Rt and Wunschel Richard J
Purchase Details
Closed on
Sep 11, 1987
Sold by
Domicile Inc
Bought by
Frandsen Kanieff Trust
Create a Home Valuation Report for This Property
The Home Valuation Report is an in-depth analysis detailing your home's value as well as a comparison with similar homes in the area
Home Values in the Area
Average Home Value in this Area
Purchase History
| Date | Buyer | Sale Price | Title Company |
|---|---|---|---|
| Greeno Peter D | $47,500 | -- | |
| 344 Providence Rd Rt | $35,000 | -- | |
| Frandsen Kanieff Trust | $475,000 | -- |
Source: Public Records
Mortgage History
| Date | Status | Borrower | Loan Amount |
|---|---|---|---|
| Open | Frandsen Kanieff Trust | $31,500 | |
| Open | Frandsen Kanieff Trust | $116,000 |
Source: Public Records
Tax History Compared to Growth
Tax History
| Year | Tax Paid | Tax Assessment Tax Assessment Total Assessment is a certain percentage of the fair market value that is determined by local assessors to be the total taxable value of land and additions on the property. | Land | Improvement |
|---|---|---|---|---|
| 2025 | $75 | $571,000 | $99,100 | $471,900 |
| 2024 | $7,345 | $543,300 | $90,100 | $453,200 |
| 2023 | $7,144 | $497,500 | $90,100 | $407,400 |
| 2022 | $7,211 | $441,300 | $83,300 | $358,000 |
| 2021 | $4,719 | $420,200 | $79,300 | $340,900 |
| 2020 | $4,987 | $382,700 | $79,300 | $303,400 |
| 2019 | $6,232 | $356,100 | $79,300 | $276,800 |
| 2018 | $5,555 | $345,700 | $79,300 | $266,400 |
| 2017 | $5,362 | $320,700 | $82,500 | $238,200 |
| 2016 | $5,204 | $309,400 | $82,500 | $226,900 |
| 2015 | $5,093 | $309,400 | $82,500 | $226,900 |
Source: Public Records
Map
Nearby Homes
- 108 Mumford St
- 5 B St
- 189 Main St
- 18 Mumford Rd
- 14 Whitin Heights
- 45 Douglas Hill Way
- 223 West St
- 2 C St
- 10 Eagle Dr
- 1 Nautical Way Unit 1
- 6 Nautical Way Unit INT.-122
- 33 Nautical Way Unit 107
- 8A Whitins Rd
- 8 Whitins Rd Unit A
- 9 Church St
- 4 1st St
- 3 S East Main St
- 3 Ledge St
- 0 Yew St Unit 73304926
- 56 Yew St