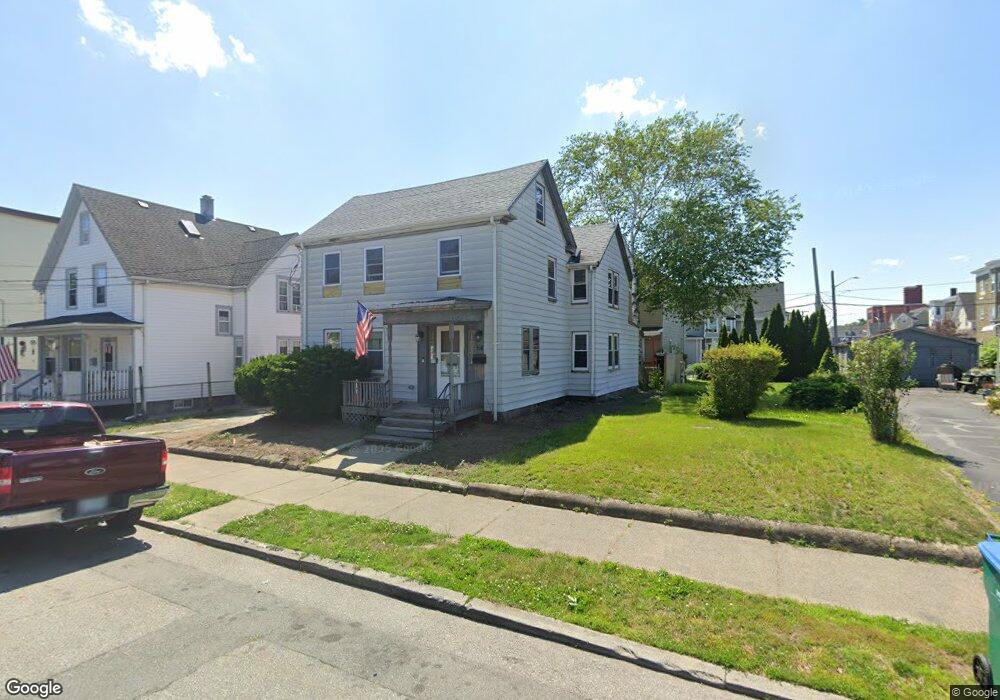
54 Grove St Lynn, MA 01905
Pine Hill NeighborhoodEstimated Value: $484,000 - $608,780
4
Beds
2
Baths
2,042
Sq Ft
$271/Sq Ft
Est. Value
About This Home
This home is located at 54 Grove St, Lynn, MA 01905 and is currently estimated at $553,445, approximately $271 per square foot. 54 Grove St is a home located in Essex County with nearby schools including North Park Elementary School, William R. Fallon School, and Tracy Elementary School.
Ownership History
Date
Name
Owned For
Owner Type
Purchase Details
Closed on
Dec 3, 2024
Sold by
Fowler Linda J
Bought by
Ardon Isaac D and Mejia-Ardon Laura
Current Estimated Value
Home Financials for this Owner
Home Financials are based on the most recent Mortgage that was taken out on this home.
Original Mortgage
$437,000
Outstanding Balance
$432,569
Interest Rate
6.54%
Mortgage Type
Purchase Money Mortgage
Estimated Equity
$120,876
Purchase Details
Closed on
Sep 1, 1995
Sold by
Nevins John J
Bought by
Taylor Gene A and Taylor Annemarie
Create a Home Valuation Report for This Property
The Home Valuation Report is an in-depth analysis detailing your home's value as well as a comparison with similar homes in the area
Home Values in the Area
Average Home Value in this Area
Purchase History
| Date | Buyer | Sale Price | Title Company |
|---|---|---|---|
| Ardon Isaac D | $460,000 | None Available | |
| Taylor Gene A | $55,000 | -- | |
| Taylor Gene A | $55,000 | -- |
Source: Public Records
Mortgage History
| Date | Status | Borrower | Loan Amount |
|---|---|---|---|
| Open | Ardon Isaac D | $437,000 | |
| Previous Owner | Taylor Gene A | $121,360 | |
| Previous Owner | Taylor Gene A | $137,000 |
Source: Public Records
Tax History Compared to Growth
Tax History
| Year | Tax Paid | Tax Assessment Tax Assessment Total Assessment is a certain percentage of the fair market value that is determined by local assessors to be the total taxable value of land and additions on the property. | Land | Improvement |
|---|---|---|---|---|
| 2025 | $5,384 | $519,700 | $183,400 | $336,300 |
| 2024 | $5,000 | $474,800 | $172,300 | $302,500 |
| 2023 | $4,820 | $432,300 | $167,000 | $265,300 |
| 2022 | $4,855 | $390,600 | $154,700 | $235,900 |
| 2021 | $4,619 | $354,500 | $148,500 | $206,000 |
| 2020 | $4,393 | $327,800 | $130,900 | $196,900 |
| 2019 | $4,143 | $289,700 | $107,100 | $182,600 |
| 2018 | $3,748 | $247,400 | $89,000 | $158,400 |
| 2017 | $3,543 | $227,100 | $75,500 | $151,600 |
| 2016 | $3,391 | $209,600 | $67,300 | $142,300 |
| 2015 | $3,206 | $191,400 | $62,800 | $128,600 |
Source: Public Records
Map
Nearby Homes
- 40 Grove St
- 75 Moulton St
- 10 Carnes St
- 274 Boston St
- 11 Linwood Rd
- 25 Bulfinch St
- 447 Boston St
- 662-664 Western Ave
- 66 Harwood St
- 39 Centre St
- 693 Western Ave Unit 101
- 108 Franklin St
- 121 N Common St
- 43 Baker St
- 99 Franklin St
- 93 Franklin St
- 81A Franklin St
- 121 Johnson St Unit 3L
- 20 Huss Ct Unit 105
- 20 Murray St