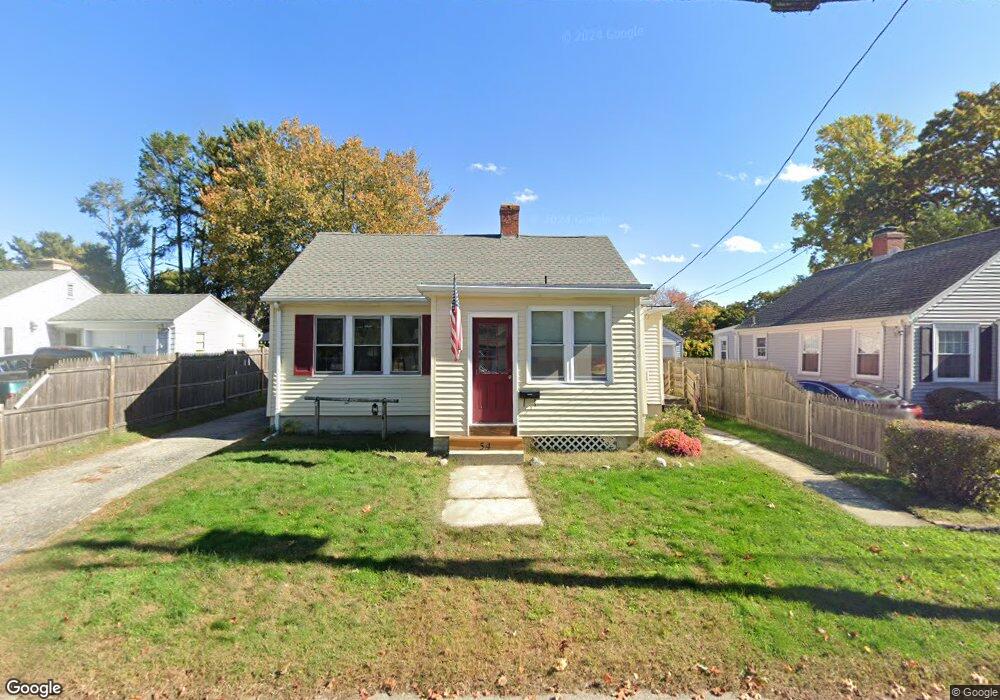
54 Hemlock Ave Cranston, RI 02910
Eden Park NeighborhoodEstimated Value: $258,000 - $371,000
1
Bed
1
Bath
724
Sq Ft
$425/Sq Ft
Est. Value
About This Home
This home is located at 54 Hemlock Ave, Cranston, RI 02910 and is currently estimated at $307,912, approximately $425 per square foot. 54 Hemlock Ave is a home located in Providence County with nearby schools including Park View Middle School, Cranston High School East, and Cadence Academy Preschool - Cranston.
Ownership History
Date
Name
Owned For
Owner Type
Purchase Details
Closed on
Apr 2, 1990
Sold by
Gustafson Ivar W
Bought by
Hathaway Alan J
Current Estimated Value
Home Financials for this Owner
Home Financials are based on the most recent Mortgage that was taken out on this home.
Original Mortgage
$70,300
Interest Rate
9.96%
Purchase Details
Closed on
Aug 31, 1989
Sold by
Helgerson Astrid A
Bought by
Gustafson Ivar W
Create a Home Valuation Report for This Property
The Home Valuation Report is an in-depth analysis detailing your home's value as well as a comparison with similar homes in the area
Home Values in the Area
Average Home Value in this Area
Purchase History
| Date | Buyer | Sale Price | Title Company |
|---|---|---|---|
| Hathaway Alan J | $100,000 | -- | |
| Gustafson Ivar W | $50,000 | -- |
Source: Public Records
Mortgage History
| Date | Status | Borrower | Loan Amount |
|---|---|---|---|
| Closed | Gustafson Ivar W | $70,300 |
Source: Public Records
Tax History
| Year | Tax Paid | Tax Assessment Tax Assessment Total Assessment is a certain percentage of the fair market value that is determined by local assessors to be the total taxable value of land and additions on the property. | Land | Improvement |
|---|---|---|---|---|
| 2025 | $3,444 | $248,100 | $105,300 | $142,800 |
| 2024 | $3,377 | $248,100 | $105,300 | $142,800 |
| 2023 | $3,391 | $179,400 | $69,300 | $110,100 |
| 2022 | $3,321 | $179,400 | $69,300 | $110,100 |
| 2021 | $3,229 | $179,400 | $69,300 | $110,100 |
| 2020 | $3,111 | $149,800 | $66,000 | $83,800 |
| 2019 | $3,111 | $149,800 | $66,000 | $83,800 |
| 2018 | $3,039 | $149,800 | $66,000 | $83,800 |
| 2017 | $3,173 | $138,300 | $59,400 | $78,900 |
| 2016 | $3,105 | $138,300 | $59,400 | $78,900 |
| 2015 | $3,105 | $138,300 | $59,400 | $78,900 |
| 2014 | $3,067 | $134,300 | $59,400 | $74,900 |
Source: Public Records
Map
Nearby Homes
Your Personal Tour Guide
Ask me questions while you tour the home.