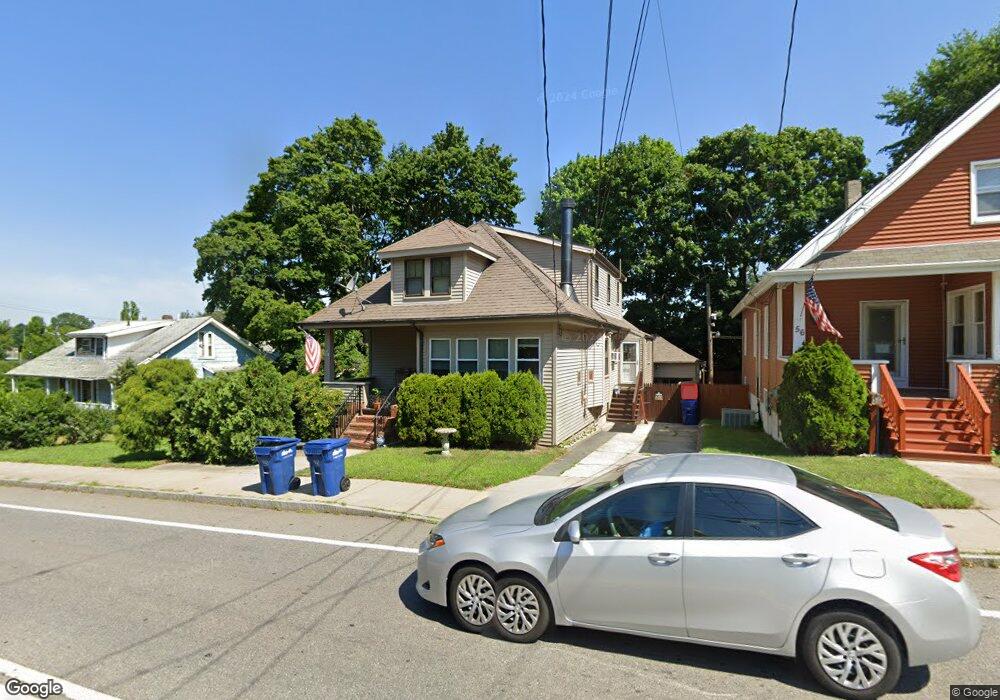
54 Howland Rd Fairhaven, MA 02719
North Fairhaven NeighborhoodEstimated Value: $442,800 - $542,000
5
Beds
2
Baths
2,041
Sq Ft
$239/Sq Ft
Est. Value
About This Home
This home is located at 54 Howland Rd, Fairhaven, MA 02719 and is currently estimated at $488,700, approximately $239 per square foot. 54 Howland Rd is a home located in Bristol County with nearby schools including Fairhaven High School, Alma Del Mar Charter School, and St. Joseph School.
Ownership History
Date
Name
Owned For
Owner Type
Purchase Details
Closed on
Sep 14, 2017
Sold by
Dacosta Armando M
Bought by
Dacosta Ft
Current Estimated Value
Purchase Details
Closed on
Sep 30, 2003
Sold by
Lopes Joyce E
Bought by
Dacosta Armando M
Purchase Details
Closed on
Apr 30, 1999
Sold by
Benoit David A and Benoit Ellen W
Bought by
Lopes Joyce E
Create a Home Valuation Report for This Property
The Home Valuation Report is an in-depth analysis detailing your home's value as well as a comparison with similar homes in the area
Home Values in the Area
Average Home Value in this Area
Purchase History
| Date | Buyer | Sale Price | Title Company |
|---|---|---|---|
| Dacosta Ft | -- | -- | |
| Dacosta Armando M | $222,200 | -- | |
| Lopes Joyce E | $127,000 | -- |
Source: Public Records
Mortgage History
| Date | Status | Borrower | Loan Amount |
|---|---|---|---|
| Previous Owner | Lopes Joyce E | $186,150 | |
| Previous Owner | Lopes Joyce E | $15,000 | |
| Previous Owner | Lopes Joyce E | $198,750 |
Source: Public Records
Tax History
| Year | Tax Paid | Tax Assessment Tax Assessment Total Assessment is a certain percentage of the fair market value that is determined by local assessors to be the total taxable value of land and additions on the property. | Land | Improvement |
|---|---|---|---|---|
| 2025 | $32 | $342,600 | $135,600 | $207,000 |
| 2024 | $3,099 | $335,700 | $135,600 | $200,100 |
| 2023 | $2,986 | $300,100 | $114,700 | $185,400 |
| 2022 | $2,837 | $277,600 | $104,300 | $173,300 |
| 2021 | $2,755 | $244,000 | $93,900 | $150,100 |
| 2020 | $2,641 | $238,800 | $88,700 | $150,100 |
| 2019 | $2,844 | $243,700 | $88,700 | $155,000 |
| 2018 | $2,635 | $232,300 | $84,800 | $147,500 |
| 2017 | $2,575 | $213,900 | $79,500 | $134,400 |
| 2016 | $2,448 | $201,000 | $78,200 | $122,800 |
| 2015 | $2,404 | $197,900 | $78,200 | $119,700 |
Source: Public Records
Map
Nearby Homes
Your Personal Tour Guide
Ask me questions while you tour the home.