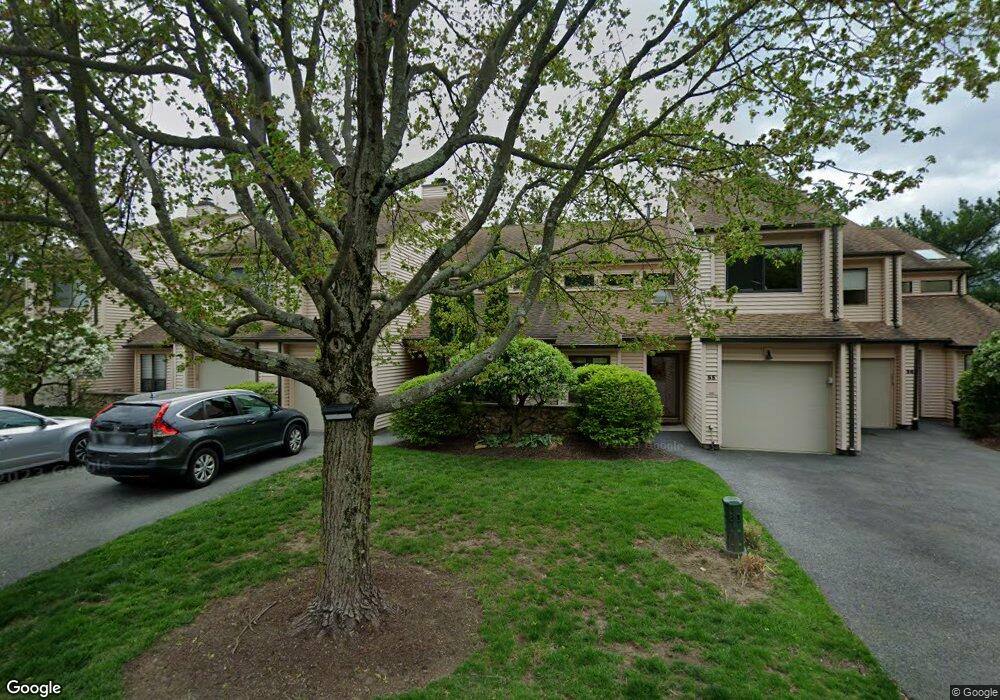
54 Hudson Watch Dr Ossining, NY 10562
North Ossining NeighborhoodEstimated Value: $564,000 - $651,213
2
Beds
2
Baths
1,629
Sq Ft
$374/Sq Ft
Est. Value
About This Home
This home is located at 54 Hudson Watch Dr, Ossining, NY 10562 and is currently estimated at $608,738, approximately $373 per square foot. 54 Hudson Watch Dr is a home located in Westchester County with nearby schools including Park School, Claremont School, and Roosevelt Elementary School.
Ownership History
Date
Name
Owned For
Owner Type
Purchase Details
Closed on
Jul 30, 2009
Sold by
Barry John P
Bought by
Ryan Deborah A
Current Estimated Value
Home Financials for this Owner
Home Financials are based on the most recent Mortgage that was taken out on this home.
Original Mortgage
$5,115
Interest Rate
5.36%
Mortgage Type
New Conventional
Purchase Details
Closed on
Aug 29, 2007
Sold by
Scoperllitti Anthony and Fiorillo Matthew
Bought by
Ryan Deborah A and Barry John P
Home Financials for this Owner
Home Financials are based on the most recent Mortgage that was taken out on this home.
Original Mortgage
$335,900
Interest Rate
6.7%
Mortgage Type
Purchase Money Mortgage
Purchase Details
Closed on
Jul 24, 2006
Sold by
Pegues Clara and Johnson Nadine
Bought by
Scopelliti Anthony and Fiorillo Matthew
Create a Home Valuation Report for This Property
The Home Valuation Report is an in-depth analysis detailing your home's value as well as a comparison with similar homes in the area
Home Values in the Area
Average Home Value in this Area
Purchase History
| Date | Buyer | Sale Price | Title Company |
|---|---|---|---|
| Ryan Deborah A | $209,500 | None Available | |
| Ryan Deborah A | $419,900 | None Available | |
| Scopelliti Anthony | $380,000 | Chicago Title Insurance Co |
Source: Public Records
Mortgage History
| Date | Status | Borrower | Loan Amount |
|---|---|---|---|
| Previous Owner | Ryan Deborah A | $5,115 | |
| Previous Owner | Ryan Deborah A | $335,900 |
Source: Public Records
Tax History Compared to Growth
Tax History
| Year | Tax Paid | Tax Assessment Tax Assessment Total Assessment is a certain percentage of the fair market value that is determined by local assessors to be the total taxable value of land and additions on the property. | Land | Improvement |
|---|---|---|---|---|
| 2024 | $12,250 | $466,200 | $105,800 | $360,400 |
| 2023 | $11,808 | $433,000 | $105,800 | $327,200 |
| 2022 | $11,484 | $398,100 | $105,800 | $292,300 |
| 2021 | $11,154 | $359,700 | $105,800 | $253,900 |
| 2020 | $11,113 | $349,200 | $105,800 | $243,400 |
| 2019 | $10,867 | $339,200 | $84,700 | $254,500 |
| 2018 | $10,877 | $336,000 | $84,700 | $251,300 |
| 2017 | $6,158 | $336,000 | $84,700 | $251,300 |
| 2016 | $112,005 | $320,000 | $84,700 | $235,300 |
| 2015 | -- | $21,120 | $4,000 | $17,120 |
| 2014 | -- | $21,120 | $4,000 | $17,120 |
| 2013 | -- | $21,120 | $4,000 | $17,120 |
Source: Public Records
Map
Nearby Homes
- 63 Cedar Ln
- 9 Gualtiere Ln
- 70 Cedar Ln
- 101 Eagle Bay Dr Unit 101
- 11 Knollwood Dr
- 5 Sabrina Ln
- 2 Briarcliff Dr S Unit 3
- 7 Briarcliff Dr S Unit 13
- 7 Locust Rd
- 707 Eagle Bay Dr
- 143 N Highland Ave
- 39 Terrace Ave
- 7 Hawkes Ave
- 135 N Highland Ave
- 14 Steven Dr
- 5 Glen St
- 9 High Ridge Rd
- 0 van Wyck St Unit KEY834077
- 10 Nicole Cir Unit 12
- 126 Whitetail Cir
- 53 Hudson Watch Dr
- 52 Hudson Watch Dr
- 55 Hudson Watch Dr
- 56 Hudson Watch Dr
- 51 Hudson Watch Dr
- 50 Hudson Watch Dr
- 24 Hudson Watch Dr
- 49 Hudson Watch Dr
- 25 Hudson Watch Dr
- 23 Hudson Watch Dr
- 26 Hudson Watch Dr
- 27 Hudson Watch Dr
- 48 Hudson Watch Dr
- 28 Hudson Watch Dr
- 22 Hudson Watch Dr
- 33 Hudson Watch Dr
- 34 Hudson Watch Dr
- 35 Hudson Watch Dr
- 21 Hudson Watch Dr
- 59 Hudson Watch Dr