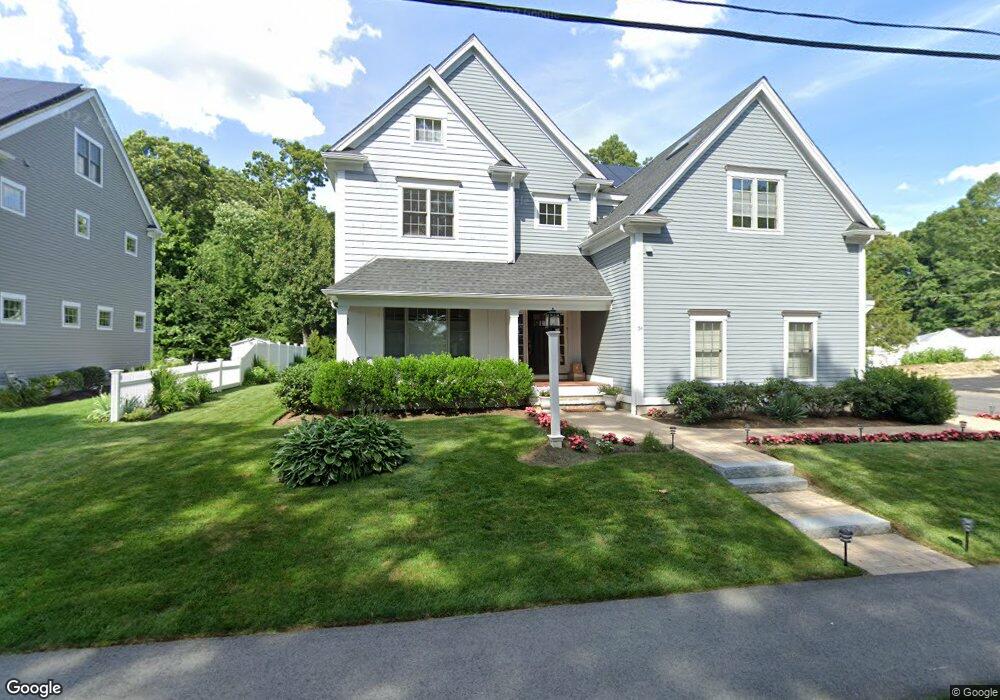
54 Lakin St Unit 54 Needham Heights, MA 02494
Estimated Value: $2,364,000 - $3,316,000
2
Beds
1
Bath
816
Sq Ft
$3,343/Sq Ft
Est. Value
About This Home
This home is located at 54 Lakin St Unit 54, Needham Heights, MA 02494 and is currently estimated at $2,728,047, approximately $3,343 per square foot. 54 Lakin St Unit 54 is a home located in Norfolk County with nearby schools including Eliot Elementary School, High Rock Middle School, and Pollard Middle School.
Ownership History
Date
Name
Owned For
Owner Type
Purchase Details
Closed on
Aug 30, 2018
Sold by
Briarwood Rt
Bought by
Olde Landmark Builders
Current Estimated Value
Home Financials for this Owner
Home Financials are based on the most recent Mortgage that was taken out on this home.
Original Mortgage
$530,000
Outstanding Balance
$453,458
Interest Rate
3.75%
Mortgage Type
New Conventional
Estimated Equity
$2,274,589
Purchase Details
Closed on
Jun 15, 2018
Sold by
Briarwood Rt and Jepsky
Bought by
Olde Landmark Builders
Create a Home Valuation Report for This Property
The Home Valuation Report is an in-depth analysis detailing your home's value as well as a comparison with similar homes in the area
Home Values in the Area
Average Home Value in this Area
Purchase History
| Date | Buyer | Sale Price | Title Company |
|---|---|---|---|
| Olde Landmark Builders | -- | -- | |
| Cedar Rt | -- | -- | |
| Olde Landmark Builders | -- | -- | |
| Olde Landmark Builders | -- | -- |
Source: Public Records
Mortgage History
| Date | Status | Borrower | Loan Amount |
|---|---|---|---|
| Open | Olde Landmark Builders | $530,000 |
Source: Public Records
Tax History Compared to Growth
Tax History
| Year | Tax Paid | Tax Assessment Tax Assessment Total Assessment is a certain percentage of the fair market value that is determined by local assessors to be the total taxable value of land and additions on the property. | Land | Improvement |
|---|---|---|---|---|
| 2025 | $26,466 | $2,496,800 | $745,600 | $1,751,200 |
| 2024 | $26,837 | $2,143,500 | $481,100 | $1,662,400 |
| 2023 | $26,032 | $1,996,300 | $481,100 | $1,515,200 |
| 2022 | $24,888 | $1,861,500 | $429,600 | $1,431,900 |
| 2021 | $24,255 | $1,861,500 | $429,600 | $1,431,900 |
| 2020 | $22,376 | $1,791,500 | $429,600 | $1,361,900 |
| 2019 | $19,165 | $1,546,800 | $390,600 | $1,156,200 |
Source: Public Records
Map
Nearby Homes
- 48 Taylor St
- 443 Central Ave
- 14 Hunnewell St
- 78 Hunnewell St
- 310 Oakland St
- 70 Booth St
- 263 Hunnewell St
- 35 Andrea Cir
- 206 Cedar St
- 7 Avery St
- 208 Webster St
- 71 Brookside Rd
- 381 Hunnewell St Unit 381
- 379 Hunnewell St Unit 379
- 132 Hillside Ave
- 400 Hunnewell St Unit 103
- 760 Highland Ave Unit 2
- 6 Willow St
- 36 Davenport Rd
- 22 Priscilla Cir