
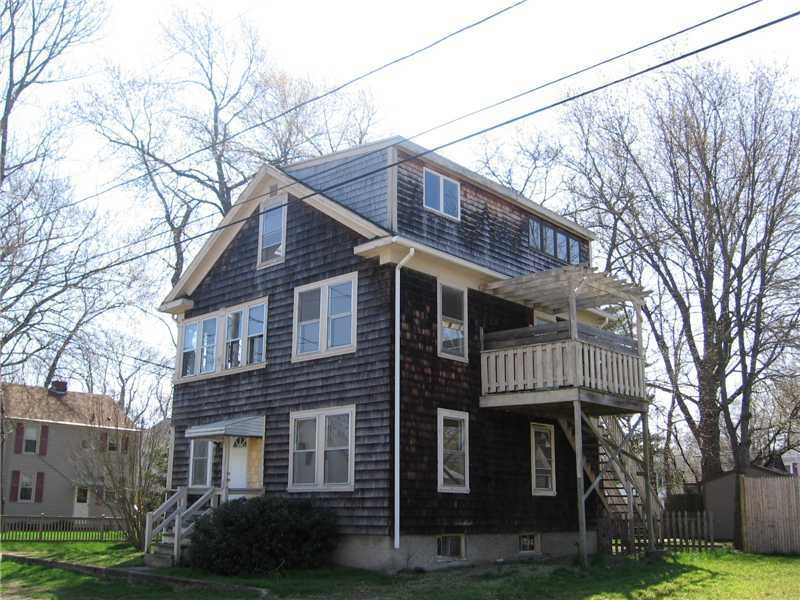
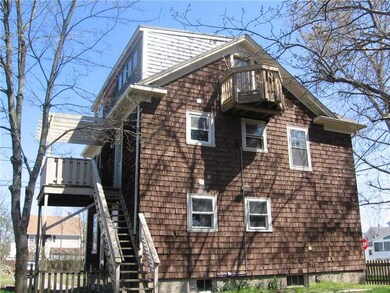
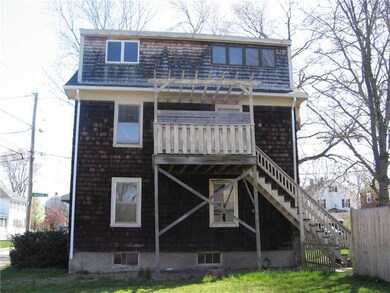

54 Locust St Riverside, RI 02915
Riverside NeighborhoodEstimated Value: $429,000 - $464,000
5
Beds
2
Baths
1,820
Sq Ft
$249/Sq Ft
Est. Value
Highlights
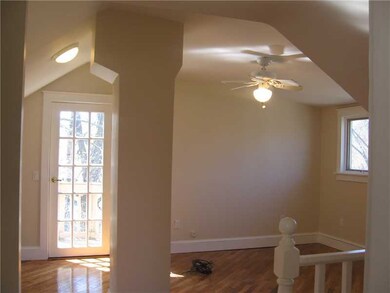
- Cathedral Ceiling
- Balcony
- Skylights
- Wood Flooring
- Walking Distance to Water
- Storage Room
About This Home
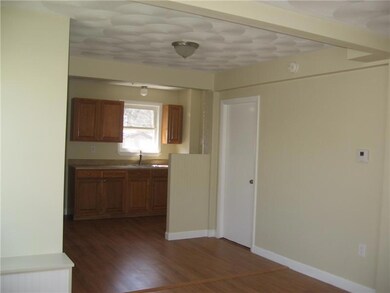
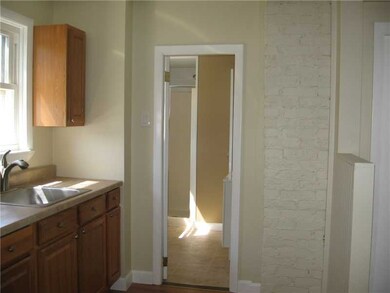
As of June 2013Completely remodeled two unit near Sabin Point. New boilers & HW tanks. Interior repainted, refinished hardwoods,etc. 2nd & 3rd floors are townhouse type unit. New taxes 6/1/13. All highest and best offers by Thursday, May 9th at 3pm.
Last Agent to Sell the Property
Richard Lemos
RE/MAX Preferred License #REB.0012917 Listed on: 05/02/2013
Last Buyer's Agent
Margaret Chapman
Chapman And Partners License #REB.0016298
Property Details
Home Type
- Multi-Family
Year Built
- Built in 1900
Lot Details
- 3,600 Sq Ft Lot
Home Design
- Shingle Siding
- Plaster
Interior Spaces
- 1,820 Sq Ft Home
- 3-Story Property
- Cathedral Ceiling
- Skylights
- Storage Room
- Unfinished Basement
- Basement Fills Entire Space Under The House
- Dishwasher
Flooring
- Wood
- Ceramic Tile
Bedrooms and Bathrooms
- 5 Bedrooms
- 2 Full Bathrooms
Parking
- 3 Parking Spaces
- No Garage
Outdoor Features
- Walking Distance to Water
- Balcony
- Outbuilding
Utilities
- No Cooling
- Heating System Uses Gas
- Heating System Uses Steam
- 100 Amp Service
- Electric Water Heater
Listing and Financial Details
- Tenant pays for hot water
- Tax Lot 58
- Assessor Parcel Number 54LOCUSTSTEPRO
Community Details
Overview
- 2 Units
- Riverside Subdivision
Amenities
- Shops
- Public Transportation
Building Details
- Operating Expense $6,500
Ownership History
Date
Name
Owned For
Owner Type
Purchase Details
Closed on
Jul 26, 2023
Sold by
Sundaresh Aarav H
Bought by
Sundaresh Ft and Sundaresh
Total Days on Market
23
Current Estimated Value
Purchase Details
Closed on
Mar 8, 2021
Sold by
Massa Elizabeth A
Bought by
Gallagher Eric and Gallagher Elizabeth
Home Financials for this Owner
Home Financials are based on the most recent Mortgage that was taken out on this home.
Original Mortgage
$161,000
Interest Rate
2.7%
Mortgage Type
Stand Alone Refi Refinance Of Original Loan
Purchase Details
Closed on
Mar 30, 2016
Sold by
Sundaresh Aarav H and Batchelder Katherine A
Bought by
Sundaresh Aarav H and Batchelder Katherine A
Purchase Details
Listed on
May 2, 2013
Closed on
Jun 25, 2013
Sold by
Bcf Realty Llc
Bought by
Gallagher Eric and Massa Elizabeth A
Seller's Agent
Richard Lemos
RE/MAX Preferred
Buyer's Agent
Margaret Chapman
Chapman And Partners
List Price
$154,900
Sold Price
$160,000
Premium/Discount to List
$5,100
3.29%
Home Financials for this Owner
Home Financials are based on the most recent Mortgage that was taken out on this home.
Avg. Annual Appreciation
9.88%
Purchase Details
Closed on
Feb 6, 2012
Sold by
King Carl and Citmortgage Inc
Bought by
Citimortgage Inc
Purchase Details
Closed on
Dec 12, 2011
Sold by
Rotondo Michael J and Deutsche Bank T Co
Bought by
Deutsche Bank T Co
Purchase Details
Closed on
May 15, 2006
Sold by
Jennings Robbie
Bought by
King Carl and King Astrid
Purchase Details
Closed on
Nov 1, 2004
Sold by
Smith Kimberly and Smith William
Bought by
Rotondo Michael
Purchase Details
Closed on
Feb 27, 1998
Sold by
Mccauley Darnell C
Bought by
Jennings Robbie
Similar Homes in Riverside, RI
Create a Home Valuation Report for This Property
The Home Valuation Report is an in-depth analysis detailing your home's value as well as a comparison with similar homes in the area
Home Values in the Area
Average Home Value in this Area
Purchase History
| Date | Buyer | Sale Price | Title Company |
|---|---|---|---|
| Sundaresh Ft | -- | None Available | |
| Sundaresh Ft | -- | None Available | |
| Gallagher Eric | -- | None Available | |
| Gallagher Eric | -- | None Available | |
| Sundaresh Aarav H | -- | -- | |
| Sundaresh Aarav H | -- | -- | |
| Gallagher Eric | $160,000 | -- | |
| Gallagher Eric | $160,000 | -- | |
| Citimortgage Inc | $123,370 | -- | |
| Citimortgage Inc | $123,370 | -- | |
| Deutsche Bank T Co | $136,400 | -- | |
| Deutsche Bank T Co | $136,400 | -- | |
| King Carl | $433,000 | -- | |
| King Carl | $433,000 | -- | |
| Rotondo Michael | $260,000 | -- | |
| Rotondo Michael | $260,000 | -- | |
| Jennings Robbie | $118,000 | -- | |
| Jennings Robbie | $118,000 | -- |
Source: Public Records
Mortgage History
| Date | Status | Borrower | Loan Amount |
|---|---|---|---|
| Previous Owner | Gallagher Eric | $161,000 | |
| Previous Owner | Gallagher Eric | $161,000 | |
| Previous Owner | Smith William K | $25,000 |
Source: Public Records
Property History
| Date | Event | Price | Change | Sq Ft Price |
|---|---|---|---|---|
| 06/25/2013 06/25/13 | Sold | $160,000 | +3.3% | $88 / Sq Ft |
| 05/26/2013 05/26/13 | Pending | -- | -- | -- |
| 05/02/2013 05/02/13 | For Sale | $154,900 | +103.8% | $85 / Sq Ft |
| 10/05/2012 10/05/12 | Sold | $76,000 | -36.6% | $38 / Sq Ft |
| 09/05/2012 09/05/12 | Pending | -- | -- | -- |
| 02/08/2012 02/08/12 | For Sale | $119,900 | -- | $60 / Sq Ft |
Source: State-Wide MLS
Tax History Compared to Growth
Tax History
| Year | Tax Paid | Tax Assessment Tax Assessment Total Assessment is a certain percentage of the fair market value that is determined by local assessors to be the total taxable value of land and additions on the property. | Land | Improvement |
|---|---|---|---|---|
| 2024 | $5,221 | $340,600 | $69,000 | $271,600 |
| 2023 | $5,027 | $340,600 | $69,000 | $271,600 |
| 2022 | $4,658 | $213,100 | $49,100 | $164,000 |
| 2021 | $4,582 | $213,100 | $48,200 | $164,900 |
| 2020 | $4,388 | $213,100 | $48,200 | $164,900 |
| 2019 | $4,266 | $213,100 | $48,200 | $164,900 |
| 2018 | $4,073 | $178,000 | $48,300 | $129,700 |
| 2017 | $3,982 | $178,000 | $48,300 | $129,700 |
| 2016 | $3,962 | $178,000 | $48,300 | $129,700 |
| 2015 | $3,683 | $160,500 | $49,200 | $111,300 |
| 2014 | $3,683 | $160,500 | $49,200 | $111,300 |
Source: Public Records
Agents Affiliated with this Home
-
R
Seller's Agent in 2013
Richard Lemos
RE/MAX Preferred
-
M
Buyer's Agent in 2013
Margaret Chapman
Chapman And Partners
-
T
Seller's Agent in 2012
Tom Brady Group
RE/MAX Preferred
Map
Source: State-Wide MLS
MLS Number: 1040012
APN: EPRO-000312-000058-000006
Disclaimer: Certain information contained herein is derived from information provided by parties other than Homes.com. All information provided is deemed reliable, but is not guaranteed to be accurate and should be independently verified.
![]() IDX information is provided exclusively for personal, non-commercial use, and may not be used for any purpose other than to identify prospective properties consumers may be interested in purchasing. Information is deemed reliable but not guaranteed.
IDX information is provided exclusively for personal, non-commercial use, and may not be used for any purpose other than to identify prospective properties consumers may be interested in purchasing. Information is deemed reliable but not guaranteed.
Copyright © 2025 State-Wide MLS, Inc. All rights reserved.
Nearby Homes
- 75 Cedar Ave
- 66 Earl Ave Unit 68
- 457 Bullocks Point Ave
- 129 Shore Rd
- 106 Providence Ave
- 27 Monroe Ave Unit 31
- 62 Fenner Ave
- 29 Hoppin Ave
- 19 Jackson Ave
- 50 Washington Ave
- 84 Worcester Ave
- 139 Dorr Ave
- 64 Dyer Ave
- 61 Peach Orchard Dr
- 150 Allen Ave
- 35 Arnold St
- 20 Harding Ave
- 136 Oak Crest Dr
- 15 Willett Ave
- 29 Lindy Ave