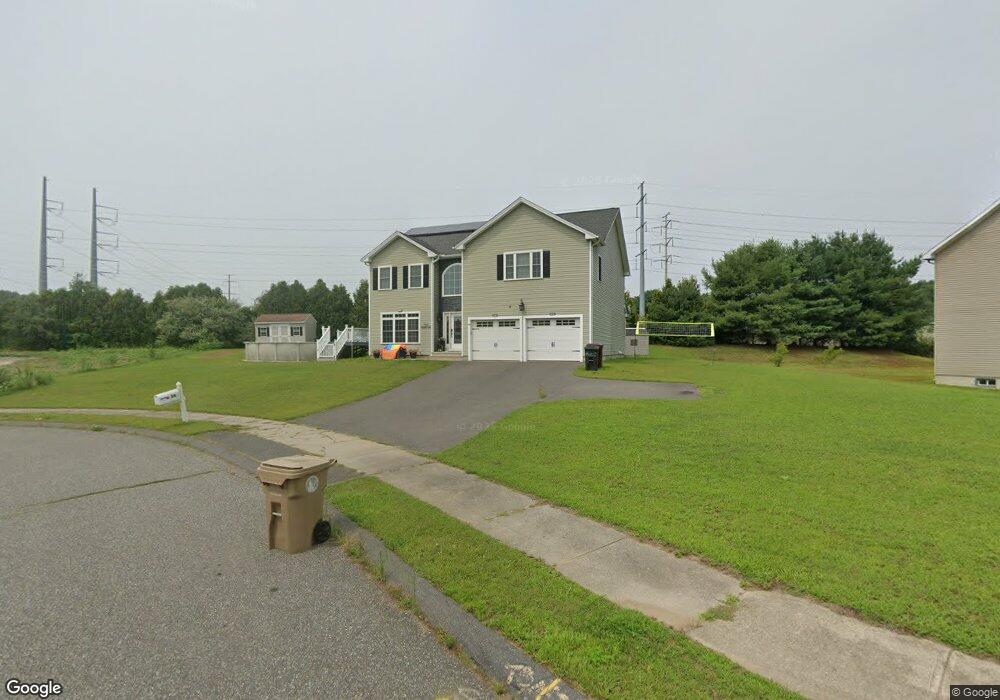
54 Mariana Way Ludlow, MA 01056
Estimated Value: $574,884 - $685,000
4
Beds
3
Baths
2,912
Sq Ft
$219/Sq Ft
Est. Value
About This Home
This home is located at 54 Mariana Way, Ludlow, MA 01056 and is currently estimated at $637,221, approximately $218 per square foot. 54 Mariana Way is a home with nearby schools including East Street Elementary School, Chapin Street Elementary School, and Paul R. Baird Middle School.
Ownership History
Date
Name
Owned For
Owner Type
Purchase Details
Closed on
Apr 26, 2007
Sold by
A & A Goncalves Rt
Bought by
Rosario Juan A and Rosario Madeline
Current Estimated Value
Home Financials for this Owner
Home Financials are based on the most recent Mortgage that was taken out on this home.
Original Mortgage
$84,000
Outstanding Balance
$51,122
Interest Rate
6.18%
Mortgage Type
Purchase Money Mortgage
Estimated Equity
$586,099
Create a Home Valuation Report for This Property
The Home Valuation Report is an in-depth analysis detailing your home's value as well as a comparison with similar homes in the area
Home Values in the Area
Average Home Value in this Area
Purchase History
| Date | Buyer | Sale Price | Title Company |
|---|---|---|---|
| Rosario Juan A | $105,000 | -- | |
| Rosario Juan A | $105,000 | -- |
Source: Public Records
Mortgage History
| Date | Status | Borrower | Loan Amount |
|---|---|---|---|
| Open | Rosario Juan A | $84,000 | |
| Closed | Rosario Juan A | $84,000 |
Source: Public Records
Tax History Compared to Growth
Tax History
| Year | Tax Paid | Tax Assessment Tax Assessment Total Assessment is a certain percentage of the fair market value that is determined by local assessors to be the total taxable value of land and additions on the property. | Land | Improvement |
|---|---|---|---|---|
| 2025 | $9,145 | $527,100 | $91,600 | $435,500 |
| 2024 | $8,709 | $481,400 | $91,600 | $389,800 |
| 2023 | $8,694 | $445,600 | $83,800 | $361,800 |
| 2022 | $8,278 | $414,100 | $87,300 | $326,800 |
| 2021 | $8,274 | $392,500 | $87,300 | $305,200 |
| 2020 | $7,984 | $387,200 | $86,000 | $301,200 |
| 2019 | $7,631 | $385,000 | $85,200 | $299,800 |
| 2018 | $7,161 | $376,700 | $85,200 | $291,500 |
| 2017 | $6,971 | $376,200 | $84,500 | $291,700 |
| 2016 | $6,879 | $379,400 | $82,800 | $296,600 |
| 2015 | $5,955 | $344,400 | $81,900 | $262,500 |
Source: Public Records
Map
Nearby Homes