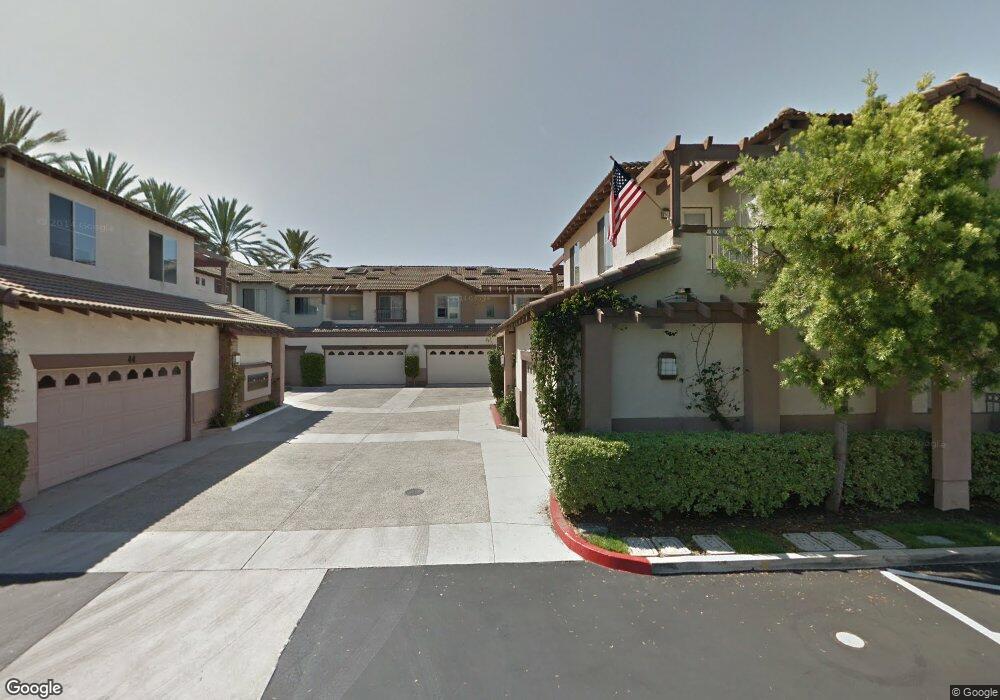
54 Mission Ct Unit 201 Foothill Ranch, CA 92610
Estimated Value: $665,000 - $726,000
About This Home
This home is located at 54 Mission Ct Unit 201, Foothill Ranch, CA 92610 and is currently estimated at $705,242, approximately $640 per square foot. 54 Mission Ct Unit 201 is a home located in Orange County with nearby schools including Foothill Ranch Elementary School, Rancho Santa Margarita Intermediate School, and Trabuco Hills High School.
Ownership History
Purchase Details
Home Financials for this Owner
Home Financials are based on the most recent Mortgage that was taken out on this home.Purchase Details
Home Financials for this Owner
Home Financials are based on the most recent Mortgage that was taken out on this home.Purchase Details
Home Financials for this Owner
Home Financials are based on the most recent Mortgage that was taken out on this home.Home Values in the Area
Average Home Value in this Area
Purchase History
We collect this data history from publicly available records. To have your information removed, we recommend requesting removal directly through your county’s website.
| Date | Buyer | Sale Price | Title Company |
|---|---|---|---|
| Pham Michelle L | -- | Benefit Land Title Company | |
| Pham Michelle L | $129,000 | Chicago Title Co | |
| Pham Michelle L | -- | Chicago Title Co |
Mortgage History
We collect this data history from publicly available records. To have your information removed, we recommend requesting removal directly through your county’s website.
| Date | Status | Borrower | Loan Amount |
|---|---|---|---|
| Open | Pham Michelle L | $124,000 | |
| Closed | Pham Michelle L | $124,850 |
Tax History
| Year | Tax Paid | Tax Assessment Tax Assessment Total Assessment is a certain percentage of the fair market value that is determined by local assessors to be the total taxable value of land and additions on the property. | Land | Improvement |
|---|---|---|---|---|
| 2025 | $2,118 | $214,286 | $50,074 | $164,212 |
| 2024 | $2,118 | $210,085 | $49,092 | $160,993 |
| 2023 | $2,067 | $205,966 | $48,129 | $157,837 |
| 2022 | $2,028 | $201,928 | $47,185 | $154,743 |
| 2021 | $1,717 | $197,969 | $46,260 | $151,709 |
| 2020 | $1,968 | $195,940 | $45,786 | $150,154 |
| 2019 | $1,928 | $192,099 | $44,889 | $147,210 |
| 2018 | $1,891 | $188,333 | $44,009 | $144,324 |
| 2017 | $1,851 | $184,641 | $43,146 | $141,495 |
| 2016 | $2,127 | $181,021 | $42,300 | $138,721 |
| 2015 | $2,123 | $178,302 | $41,664 | $136,638 |
| 2014 | $2,362 | $174,810 | $40,848 | $133,962 |
Map
- 52 Mission Ct Unit 202
- 56 Mission Ct Unit 200
- 50 Mission Ct
- 58 Mission Ct
- 48 Mission Ct
- 60 Mission Ct Unit 197
- 62 Mission Ct
- 64 Mission Ct
- 46 Mission Ct
- 44 Mission Ct
- 66 Mission Ct
- 76 Mission Ct
- 74 Mission Ct Unit 192
- 38 Mission Ct
- 78 Mission Ct
- 72 Mission Ct
- 40 Mission Ct Unit 208
- 36 Mission Ct Unit 210
- 1 Carriage Dr
- 70 Mission Ct
Ask me questions while you tour the home.