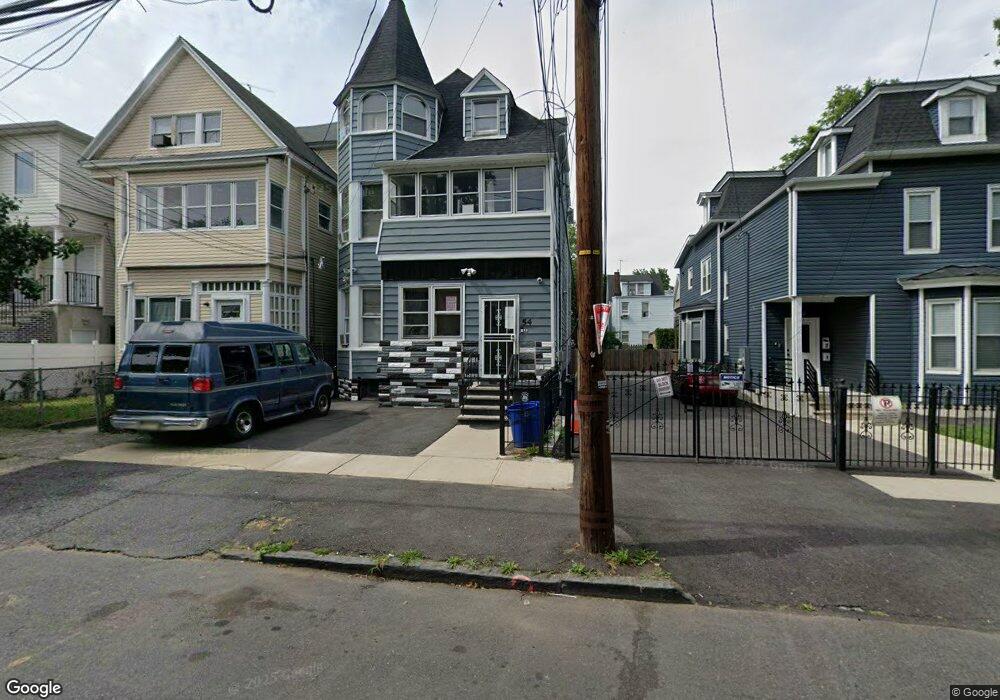
54 N 11th St Unit 3 Newark, NJ 07107
Lower Roseville NeighborhoodEstimated Value: $533,804 - $756,000
12
Beds
4
Baths
3,006
Sq Ft
$222/Sq Ft
Est. Value
About This Home
This home is located at 54 N 11th St Unit 3, Newark, NJ 07107 and is currently estimated at $667,951, approximately $222 per square foot. 54 N 11th St Unit 3 is a home located in Essex County with nearby schools including Dr. William H. Horton School, First Avenue Elementary School, and Franklin School.
Ownership History
Date
Name
Owned For
Owner Type
Purchase Details
Closed on
Jan 26, 2009
Sold by
Saldana Edgardo
Bought by
Garraway Rosa
Current Estimated Value
Home Financials for this Owner
Home Financials are based on the most recent Mortgage that was taken out on this home.
Original Mortgage
$318,986
Outstanding Balance
$201,206
Interest Rate
5.06%
Mortgage Type
FHA
Estimated Equity
$466,745
Purchase Details
Closed on
Oct 6, 2008
Sold by
Nunez Julia and Aguilar Tomas
Bought by
Saldana Edgardo
Purchase Details
Closed on
Feb 16, 2005
Sold by
Caceres Miguel
Bought by
Nunez Julia
Home Financials for this Owner
Home Financials are based on the most recent Mortgage that was taken out on this home.
Original Mortgage
$198,100
Interest Rate
6.75%
Mortgage Type
Adjustable Rate Mortgage/ARM
Purchase Details
Closed on
Aug 16, 1989
Sold by
Caceres Caceres M and Caceres Fior
Bought by
Caceres Miguel and Caceres Fior
Purchase Details
Closed on
May 26, 1989
Sold by
Woodard Doris
Bought by
Caceres Miguel and Caceres Frank
Create a Home Valuation Report for This Property
The Home Valuation Report is an in-depth analysis detailing your home's value as well as a comparison with similar homes in the area
Home Values in the Area
Average Home Value in this Area
Purchase History
| Date | Buyer | Sale Price | Title Company |
|---|---|---|---|
| Garraway Rosa | $325,000 | Title Works Inc | |
| Saldana Edgardo | -- | Title Works Inc | |
| Nunez Julia | $283,000 | -- | |
| Caceres Miguel | -- | -- | |
| Caceres Miguel | $90,000 | -- |
Source: Public Records
Mortgage History
| Date | Status | Borrower | Loan Amount |
|---|---|---|---|
| Open | Garraway Rosa | $318,986 | |
| Previous Owner | Nunez Julia | $198,100 |
Source: Public Records
Tax History Compared to Growth
Tax History
| Year | Tax Paid | Tax Assessment Tax Assessment Total Assessment is a certain percentage of the fair market value that is determined by local assessors to be the total taxable value of land and additions on the property. | Land | Improvement |
|---|---|---|---|---|
| 2025 | $6,423 | $172,300 | $16,300 | $156,000 |
| 2024 | $6,423 | $172,300 | $16,300 | $156,000 |
| 2022 | $6,437 | $172,300 | $16,300 | $156,000 |
| 2021 | $6,434 | $172,300 | $16,300 | $156,000 |
| 2020 | $6,547 | $172,300 | $16,300 | $156,000 |
| 2019 | $6,480 | $172,300 | $16,300 | $156,000 |
| 2018 | $6,363 | $172,300 | $16,300 | $156,000 |
| 2017 | $6,134 | $172,300 | $16,300 | $156,000 |
| 2016 | $5,927 | $172,300 | $16,300 | $156,000 |
| 2015 | $5,701 | $172,300 | $16,300 | $156,000 |
| 2014 | $5,343 | $172,300 | $16,300 | $156,000 |
Source: Public Records
Map
Nearby Homes
- 86 N 11th St
- 437 7th Ave W Unit 439
- 437-439 W 7th Ave Unit 4
- 108 N 13th St
- 18 William St Unit A
- 119 N 14th St
- 116 N 13th St
- 118 N 13th St
- 134 N 14th St
- 126 N 14th St
- 160-162 Roseville Ave Unit 3
- 139 N 15th St
- 139 N 15th St Unit 2
- 162 N 14th St Unit 3
- 118-120 N 9th St
- 118 N 9th St Unit 120
- 158 N 15th St
- 50 N 18th St
- 102 N 17th St
- 47-49 N 18th St
- 54 N 11th St
- 56 N 11th St
- 52 N 11th St
- 56 11th Ave W Unit 58
- 48 11th Ave W
- 60 N 11th St Unit 62
- 27 N 12th St
- 25 N 12th St
- 44 11th Ave W Unit 1
- 44 11th Ave W Unit 46
- 29 N 12th St
- 21-23 N 12th St
- 31 N 12th St
- 31 N 12th St Unit 2
- 17-19 N 12th St
- 40 11th Ave W
- 40 11th Ave W Unit 42
- 40 11th Ave W
- 40 11th Ave W Unit 2
- 40 11th Ave W Unit 3