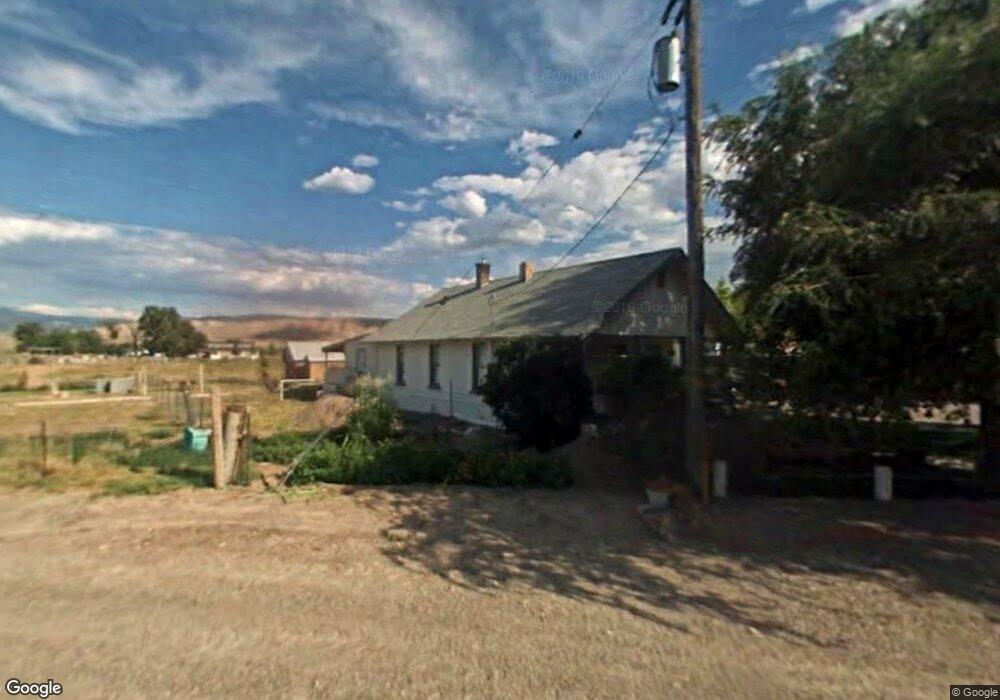
54 N State St Redmond, UT 84652
Estimated Value: $199,000 - $259,043
--
Bed
1
Bath
1,008
Sq Ft
$224/Sq Ft
Est. Value
About This Home
This home is located at 54 N State St, Redmond, UT 84652 and is currently estimated at $226,261, approximately $224 per square foot. 54 N State St is a home with nearby schools including Salina School, North Sevier Middle School, and North Sevier High School.
Ownership History
Date
Name
Owned For
Owner Type
Purchase Details
Closed on
Jun 15, 2020
Sold by
Montague Steven D and Woten Charlotte
Bought by
Hansen Shae and Hansen Mackenzie Renee
Current Estimated Value
Home Financials for this Owner
Home Financials are based on the most recent Mortgage that was taken out on this home.
Original Mortgage
$118,340
Outstanding Balance
$104,899
Interest Rate
3.2%
Mortgage Type
New Conventional
Estimated Equity
$121,362
Purchase Details
Closed on
Dec 19, 2017
Sold by
Montague Stevem D and Woten Charlotte
Bought by
Montague Steven D and Woten Charlotte
Home Financials for this Owner
Home Financials are based on the most recent Mortgage that was taken out on this home.
Original Mortgage
$99,000
Interest Rate
3.9%
Purchase Details
Closed on
Mar 30, 2012
Sold by
Hawkins Max C
Bought by
Montague Steven D
Home Financials for this Owner
Home Financials are based on the most recent Mortgage that was taken out on this home.
Original Mortgage
$85,204
Interest Rate
3.83%
Create a Home Valuation Report for This Property
The Home Valuation Report is an in-depth analysis detailing your home's value as well as a comparison with similar homes in the area
Home Values in the Area
Average Home Value in this Area
Purchase History
| Date | Buyer | Sale Price | Title Company |
|---|---|---|---|
| Hansen Shae | -- | First American Title Ins Co | |
| Montague Steven D | -- | Inwest Title Services Inc | |
| Montague Steven D | -- | Inwest Title Servic | |
| Montague Steven D | -- | First American Title Company |
Source: Public Records
Mortgage History
| Date | Status | Borrower | Loan Amount |
|---|---|---|---|
| Open | Hansen Shae | $118,340 | |
| Previous Owner | Montague Steven D | $99,000 | |
| Previous Owner | Montague Steven D | $85,204 |
Source: Public Records
Tax History Compared to Growth
Tax History
| Year | Tax Paid | Tax Assessment Tax Assessment Total Assessment is a certain percentage of the fair market value that is determined by local assessors to be the total taxable value of land and additions on the property. | Land | Improvement |
|---|---|---|---|---|
| 2024 | $1,018 | $112,898 | $29,406 | $83,492 |
| 2023 | $975 | $118,818 | $29,423 | $89,395 |
| 2022 | $1,011 | $102,169 | $28,731 | $73,438 |
| 2021 | $880 | $73,576 | $20,763 | $52,813 |
| 2020 | $783 | $61,389 | $20,763 | $40,626 |
| 2019 | $717 | $60,030 | $20,760 | $39,270 |
| 2018 | $671 | $49,810 | $18,690 | $31,120 |
| 2017 | $673 | $47,650 | $18,690 | $28,960 |
| 2016 | $489 | $44,470 | $0 | $0 |
| 2015 | $489 | $44,470 | $0 | $0 |
| 2014 | $489 | $41,110 | $0 | $0 |
Source: Public Records
Map
Nearby Homes
- 240 S State St
- 205 W 200 S
- 225 S 300 W
- 206 W 580 N Unit 5
- 0 W 500 S
- 0 Windy Canal Rd Unit 17
- 1819 N 1400 W
- 440 N Quarry Rd
- 630 W 285 N
- 268 N Salina Creek Dr
- 50 W 100 N
- 89 N 200 W
- 185 N Church Rd W
- 1 Willow Creek Rd
- 12 E 200 S
- 375 W Sandy Ln
- 325 Cobble St
- 321 S 200 E
- 10615 W 14500 S
- 1200 Old Highway 10