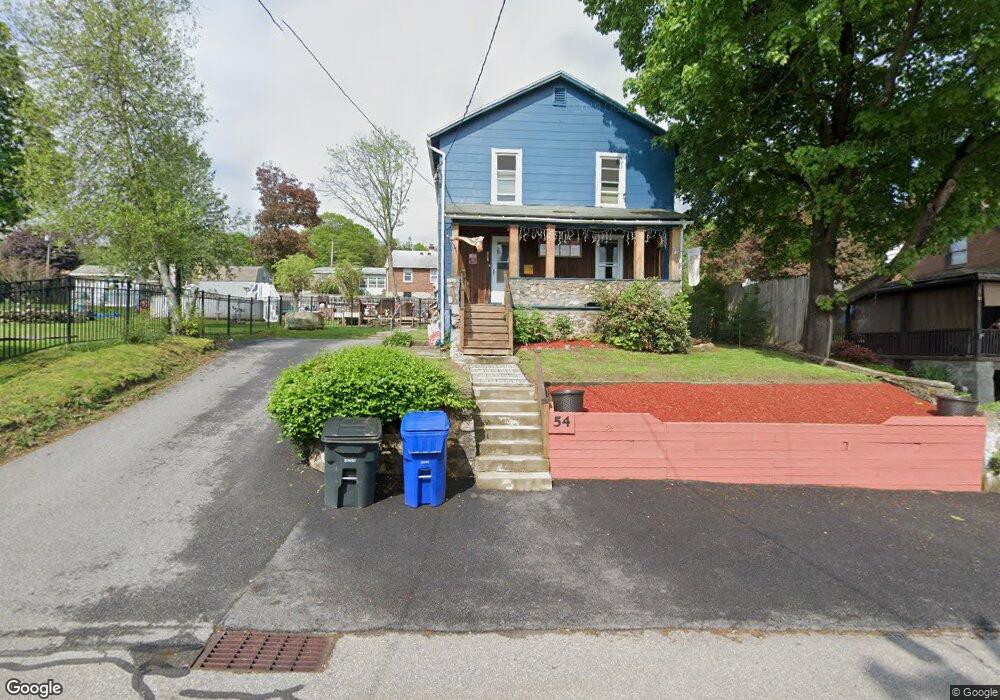
54 Nelson St Torrington, CT 06790
Estimated Value: $237,000 - $279,000
2
Beds
1
Bath
1,256
Sq Ft
$200/Sq Ft
Est. Value
About This Home
This home is located at 54 Nelson St, Torrington, CT 06790 and is currently estimated at $251,278, approximately $200 per square foot. 54 Nelson St is a home located in Litchfield County with nearby schools including Torrington Middle School, Torrington High School, and St. John Paul the Great Academy.
Ownership History
Date
Name
Owned For
Owner Type
Purchase Details
Closed on
Jan 9, 2014
Sold by
Chudy Catherine R
Bought by
Hageman Lisa
Current Estimated Value
Purchase Details
Closed on
Aug 3, 2005
Sold by
Ebinger Laura D
Bought by
Hageman Lisa and Chudy Catherine R
Home Financials for this Owner
Home Financials are based on the most recent Mortgage that was taken out on this home.
Original Mortgage
$110,800
Interest Rate
6.12%
Purchase Details
Closed on
Oct 11, 2002
Sold by
Severi Robert and Severi Judy
Bought by
Ebinger Laura D
Create a Home Valuation Report for This Property
The Home Valuation Report is an in-depth analysis detailing your home's value as well as a comparison with similar homes in the area
Home Values in the Area
Average Home Value in this Area
Purchase History
| Date | Buyer | Sale Price | Title Company |
|---|---|---|---|
| Hageman Lisa | -- | -- | |
| Hageman Lisa | $138,500 | -- | |
| Ebinger Laura D | $115,000 | -- |
Source: Public Records
Mortgage History
| Date | Status | Borrower | Loan Amount |
|---|---|---|---|
| Previous Owner | Ebinger Laura D | $110,800 | |
| Previous Owner | Ebinger Laura D | $27,700 |
Source: Public Records
Tax History
| Year | Tax Paid | Tax Assessment Tax Assessment Total Assessment is a certain percentage of the fair market value that is determined by local assessors to be the total taxable value of land and additions on the property. | Land | Improvement |
|---|---|---|---|---|
| 2025 | $5,383 | $140,000 | $23,800 | $116,200 |
| 2024 | $3,150 | $65,670 | $23,760 | $41,910 |
| 2023 | $3,150 | $65,670 | $23,760 | $41,910 |
| 2022 | $3,096 | $65,670 | $23,760 | $41,910 |
| 2021 | $3,032 | $65,670 | $23,760 | $41,910 |
| 2020 | $3,032 | $65,670 | $23,760 | $41,910 |
| 2019 | $3,566 | $77,230 | $29,190 | $48,040 |
| 2018 | $3,566 | $77,230 | $29,190 | $48,040 |
| 2017 | $3,533 | $77,230 | $29,190 | $48,040 |
| 2016 | $3,533 | $77,230 | $29,190 | $48,040 |
| 2015 | $3,533 | $77,230 | $29,190 | $48,040 |
| 2014 | $3,462 | $95,330 | $40,250 | $55,080 |
Source: Public Records
Map
Nearby Homes
- 0 Highland Ave Unit 24088105
- 17 Hawthorne Terrace
- 129 Oakbrook Ln
- 169 Central Ave
- 398 Funston Ave
- 164 Beechwood Ave
- 52 Workman Ave
- 80 Washington Ave
- 85 Ford Ln
- 155 Allen Rd
- 7 Ford Ln
- 213 Funston Ave
- 30 Culvert St
- 329 Church St
- 64 Hoffman St
- 147 Funston Ave
- 213 Spring St
- 118 Migeon Ave
- 68 Westledge Terrace
- 21 Roosevelt Ave
Your Personal Tour Guide
Ask me questions while you tour the home.