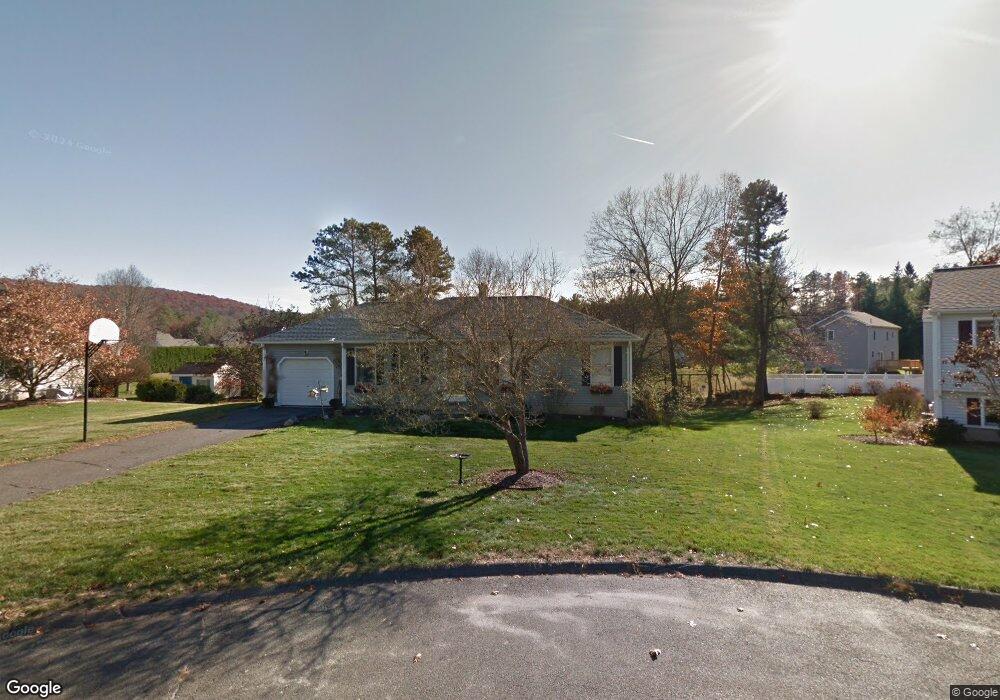
54 Overlook Dr Easthampton, MA 01027
Estimated Value: $376,000 - $420,000
3
Beds
1
Bath
1,092
Sq Ft
$366/Sq Ft
Est. Value
About This Home
This home is located at 54 Overlook Dr, Easthampton, MA 01027 and is currently estimated at $399,325, approximately $365 per square foot. 54 Overlook Dr is a home located in Hampshire County with nearby schools including Easthampton High School, Calvary Baptist Christian School, and Tri-County Schools.
Ownership History
Date
Name
Owned For
Owner Type
Purchase Details
Closed on
Jun 1, 2001
Sold by
Judd Pamela and Judd William
Bought by
Parizo Michael P and Parizo Robyn R
Current Estimated Value
Home Financials for this Owner
Home Financials are based on the most recent Mortgage that was taken out on this home.
Original Mortgage
$147,250
Interest Rate
7.09%
Mortgage Type
Purchase Money Mortgage
Create a Home Valuation Report for This Property
The Home Valuation Report is an in-depth analysis detailing your home's value as well as a comparison with similar homes in the area
Home Values in the Area
Average Home Value in this Area
Purchase History
| Date | Buyer | Sale Price | Title Company |
|---|---|---|---|
| Parizo Michael P | $155,000 | -- |
Source: Public Records
Mortgage History
| Date | Status | Borrower | Loan Amount |
|---|---|---|---|
| Open | Parizo Michael P | $147,000 | |
| Closed | Parizo Michael P | $147,250 | |
| Previous Owner | Parizo Michael P | $25,000 |
Source: Public Records
Tax History
| Year | Tax Paid | Tax Assessment Tax Assessment Total Assessment is a certain percentage of the fair market value that is determined by local assessors to be the total taxable value of land and additions on the property. | Land | Improvement |
|---|---|---|---|---|
| 2025 | $4,985 | $364,700 | $120,700 | $244,000 |
| 2024 | $4,812 | $354,900 | $117,200 | $237,700 |
| 2023 | $3,500 | $238,900 | $92,200 | $146,700 |
| 2022 | $3,949 | $238,900 | $92,200 | $146,700 |
| 2021 | $4,322 | $246,400 | $92,200 | $154,200 |
| 2020 | $4,243 | $238,900 | $92,200 | $146,700 |
| 2019 | $3,554 | $229,900 | $92,200 | $137,700 |
| 2018 | $3,402 | $212,600 | $86,900 | $125,700 |
| 2017 | $3,318 | $204,700 | $83,500 | $121,200 |
| 2016 | $3,302 | $211,800 | $83,500 | $128,300 |
| 2015 | $3,209 | $211,800 | $83,500 | $128,300 |
Source: Public Records
Map
Nearby Homes
Your Personal Tour Guide
Ask me questions while you tour the home.