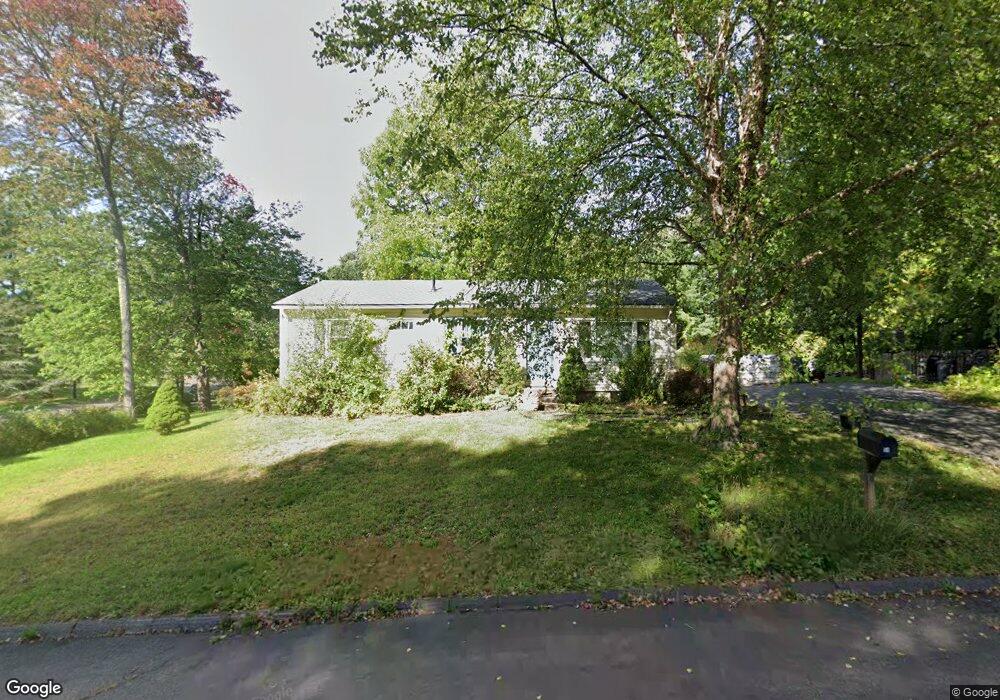
54 Overlook Dr Florence, MA 01062
Florence NeighborhoodEstimated Value: $359,158 - $377,000
4
Beds
1
Bath
1,008
Sq Ft
$365/Sq Ft
Est. Value
About This Home
This home is located at 54 Overlook Dr, Florence, MA 01062 and is currently estimated at $367,540, approximately $364 per square foot. 54 Overlook Dr is a home located in Hampshire County with nearby schools including Northampton High School and Hilltown Cooperative Charter Public School.
Ownership History
Date
Name
Owned For
Owner Type
Purchase Details
Closed on
Apr 28, 2010
Sold by
Paine Kimberli A
Bought by
Ruff Monty J and Ruff Erin M
Current Estimated Value
Home Financials for this Owner
Home Financials are based on the most recent Mortgage that was taken out on this home.
Original Mortgage
$182,249
Outstanding Balance
$121,795
Interest Rate
4.99%
Mortgage Type
Purchase Money Mortgage
Estimated Equity
$245,745
Purchase Details
Closed on
Jan 5, 2005
Sold by
Forrest Kathrine and Forrest Michael
Bought by
Paine Kimberli A
Home Financials for this Owner
Home Financials are based on the most recent Mortgage that was taken out on this home.
Original Mortgage
$149,200
Interest Rate
5.75%
Mortgage Type
Purchase Money Mortgage
Purchase Details
Closed on
Oct 8, 2004
Sold by
Morin Mary L and Mtg Electronic Reg Sys
Bought by
Forrest Kathrine and Forrest Michael
Create a Home Valuation Report for This Property
The Home Valuation Report is an in-depth analysis detailing your home's value as well as a comparison with similar homes in the area
Home Values in the Area
Average Home Value in this Area
Purchase History
| Date | Buyer | Sale Price | Title Company |
|---|---|---|---|
| Ruff Monty J | $198,400 | -- | |
| Paine Kimberli A | $186,500 | -- | |
| Forrest Kathrine | $143,000 | -- |
Source: Public Records
Mortgage History
| Date | Status | Borrower | Loan Amount |
|---|---|---|---|
| Open | Ruff Monty J | $182,249 | |
| Previous Owner | Forrest Kathrine | $149,200 | |
| Previous Owner | Forrest Kathrine | $27,975 | |
| Previous Owner | Forrest Kathrine | $86,700 |
Source: Public Records
Tax History
| Year | Tax Paid | Tax Assessment Tax Assessment Total Assessment is a certain percentage of the fair market value that is determined by local assessors to be the total taxable value of land and additions on the property. | Land | Improvement |
|---|---|---|---|---|
| 2025 | $4,544 | $326,200 | $135,100 | $191,100 |
| 2024 | $4,776 | $314,400 | $128,900 | $185,500 |
| 2023 | $3,985 | $251,600 | $117,000 | $134,600 |
| 2022 | $4,047 | $226,200 | $109,700 | $116,500 |
| 2021 | $3,641 | $209,600 | $104,700 | $104,900 |
| 2020 | $3,521 | $209,600 | $104,700 | $104,900 |
| 2019 | $3,191 | $183,700 | $89,700 | $94,000 |
| 2018 | $3,186 | $187,000 | $89,700 | $97,300 |
| 2017 | $3,121 | $187,000 | $89,700 | $97,300 |
| 2016 | $3,022 | $187,000 | $89,700 | $97,300 |
| 2015 | $2,947 | $186,500 | $89,700 | $96,800 |
| 2014 | $2,870 | $186,500 | $89,700 | $96,800 |
Source: Public Records
Map
Nearby Homes
- 723 Lot B Ryan Rd
- 815 Burts Pit Rd
- 296 Ryan Rd Unit A
- 296 Ryan Rd
- 296 Ryan Rd Unit B
- 72 Emerson Way
- 42 Clark St
- 635 Florence Rd
- 589 Florence Rd
- 697 Florence Rd
- 967 Florence Rd
- 0 W Farms Rd
- 404 Sylvester Rd
- 37 Landy Ave
- 892 Westhampton Rd
- 33 Landy Ave
- 20-11 Sylvester Rd
- 296 Old Wilson Rd
- 67 Park St Unit A
- 22 Lilly St
- 148 Deerfield Dr
- 62 Overlook Dr
- 142 Deerfield Dr
- 268 Acrebrook Dr
- 276 Acrebrook Dr
- 260 Acrebrook Dr
- 46 Overlook Dr
- 61 Overlook Dr
- 69 Overlook Dr
- 55 Overlook Dr
- 284 Acrebrook Dr
- 252 Acrebrook Dr
- 143 Deerfield Dr
- 134 Deerfield Dr
- 78 Overlook Dr
- 77 Overlook Dr
- 47 Overlook Dr
- 38 Overlook Dr
- 5 Austin Cir
- 292 Acrebrook Dr
Your Personal Tour Guide
Ask me questions while you tour the home.