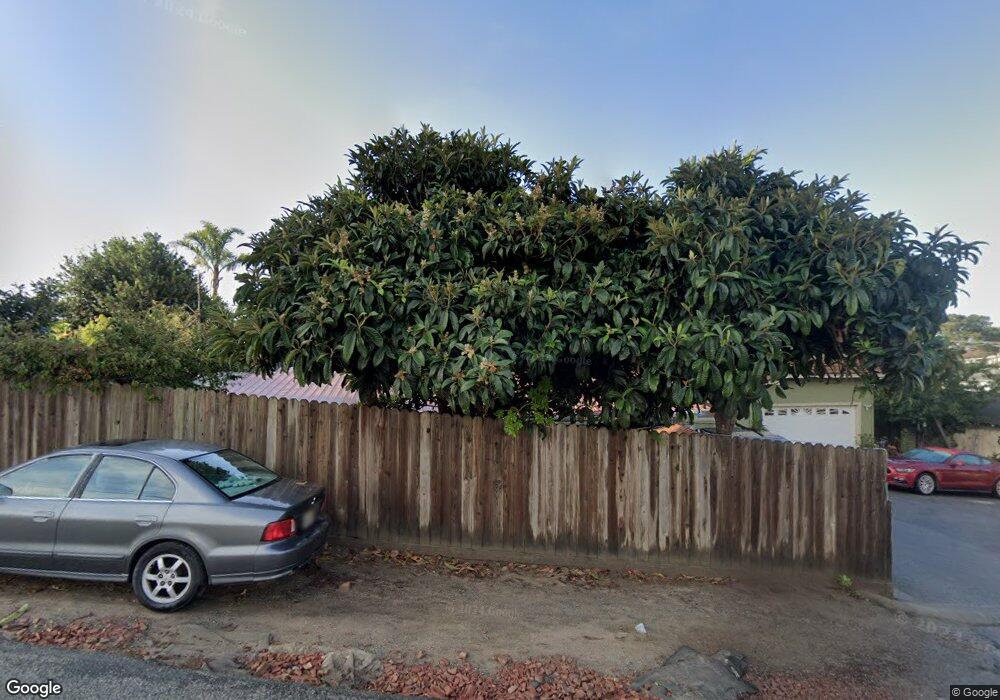
54 Overpass Rd Royal Oaks, CA 95076
Estimated Value: $933,000 - $1,688,000
6
Beds
5
Baths
3,714
Sq Ft
$322/Sq Ft
Est. Value
About This Home
This home is located at 54 Overpass Rd, Royal Oaks, CA 95076 and is currently estimated at $1,196,235, approximately $322 per square foot. 54 Overpass Rd is a home located in Monterey County with nearby schools including Hall District Elementary School, Pajaro Middle School, and Watsonville High School.
Ownership History
Date
Name
Owned For
Owner Type
Purchase Details
Closed on
Dec 6, 2021
Sold by
Verduzco Jorge Luis Rocha and Rocha Maria Ines
Bought by
Verduzco Jorge Luis Rocha and Rocha Maria Ines
Current Estimated Value
Purchase Details
Closed on
May 21, 2021
Sold by
Verduzco Jorge L Rocha and Rocha Maria Ines
Bought by
Verduzco Jorge L Rocha and Rocha Maria Ines
Home Financials for this Owner
Home Financials are based on the most recent Mortgage that was taken out on this home.
Original Mortgage
$100,000
Outstanding Balance
$60,314
Interest Rate
3%
Mortgage Type
New Conventional
Estimated Equity
$1,135,921
Purchase Details
Closed on
Jul 19, 1994
Sold by
Rocha Jorge and Rocha Maria Ines
Bought by
Rocha Jorge L and Rocha Maria Ines
Home Financials for this Owner
Home Financials are based on the most recent Mortgage that was taken out on this home.
Original Mortgage
$108,000
Interest Rate
4.95%
Create a Home Valuation Report for This Property
The Home Valuation Report is an in-depth analysis detailing your home's value as well as a comparison with similar homes in the area
Home Values in the Area
Average Home Value in this Area
Purchase History
| Date | Buyer | Sale Price | Title Company |
|---|---|---|---|
| Verduzco Jorge Luis Rocha | -- | None Available | |
| Verduzco Jorge Luis Rocha | -- | None Available | |
| Verduzco Jorge L Rocha | -- | First American Title Company | |
| Rocha Jorge L | -- | First American Title Co |
Source: Public Records
Mortgage History
| Date | Status | Borrower | Loan Amount |
|---|---|---|---|
| Open | Verduzco Jorge L Rocha | $100,000 | |
| Closed | Rocha Jorge L | $108,000 |
Source: Public Records
Tax History
| Year | Tax Paid | Tax Assessment Tax Assessment Total Assessment is a certain percentage of the fair market value that is determined by local assessors to be the total taxable value of land and additions on the property. | Land | Improvement |
|---|---|---|---|---|
| 2025 | $8,527 | $732,018 | $150,298 | $581,720 |
| 2024 | $8,527 | $717,665 | $147,351 | $570,314 |
| 2023 | $7,692 | $703,594 | $144,462 | $559,132 |
| 2022 | $7,559 | $689,799 | $141,630 | $548,169 |
| 2021 | $7,439 | $676,274 | $138,853 | $537,421 |
| 2020 | $7,226 | $669,341 | $137,430 | $531,911 |
| 2019 | $7,098 | $656,218 | $134,736 | $521,482 |
| 2018 | $6,915 | $643,352 | $132,095 | $511,257 |
| 2017 | $6,866 | $630,738 | $129,505 | $501,233 |
| 2016 | $6,683 | $618,371 | $126,966 | $491,405 |
| 2015 | $6,669 | $609,083 | $125,059 | $484,024 |
| 2014 | $6,526 | $597,153 | $122,610 | $474,543 |
Source: Public Records
Map
Nearby Homes
- 19 Overpass Rd
- 203 Las Lomas Dr
- 43 Acres Sill Rd
- 967 Salinas Rd
- 1175 Eagle Hill Rd
- 175 Johnson Rd
- 280 Hidden Valley Rd
- 3230 Hillman Ln
- 124 Gonda St
- 140 E Riverside Dr
- 138 San Miguel Canyon Rd
- 14643 Tumble Weed Ln
- 120 San Miguel Canyon Rd
- 14641 Tumble Weed Ln
- 354 San Miguel Canyon Rd
- 30 Riverside Rd
- 128 Maple Ave
- 450 Beck St
- 880 W Beach St
- 860 W Beach St
- 50 Overpass Rd
- 60 Overpass Rd
- 74 Thomas Rd
- 14206 Overpass Rd
- 14209 Overpass Rd
- 14204 Overpass Rd
- 62 Overpass Rd
- 14207 Overpass Rd
- 45 Overpass Rd
- 14205 Overpass Rd
- 40 Overpass Rd
- 14202 Overpass Rd
- 61 Overpass Rd
- 70 Thomas Rd
- 14200 Overpass Rd
- 72 Thomas Rd
- 66 Overpass Rd
- 14203 Overpass Rd
- 41 Overpass Rd
- 14201 Overpass Rd
Your Personal Tour Guide
Ask me questions while you tour the home.