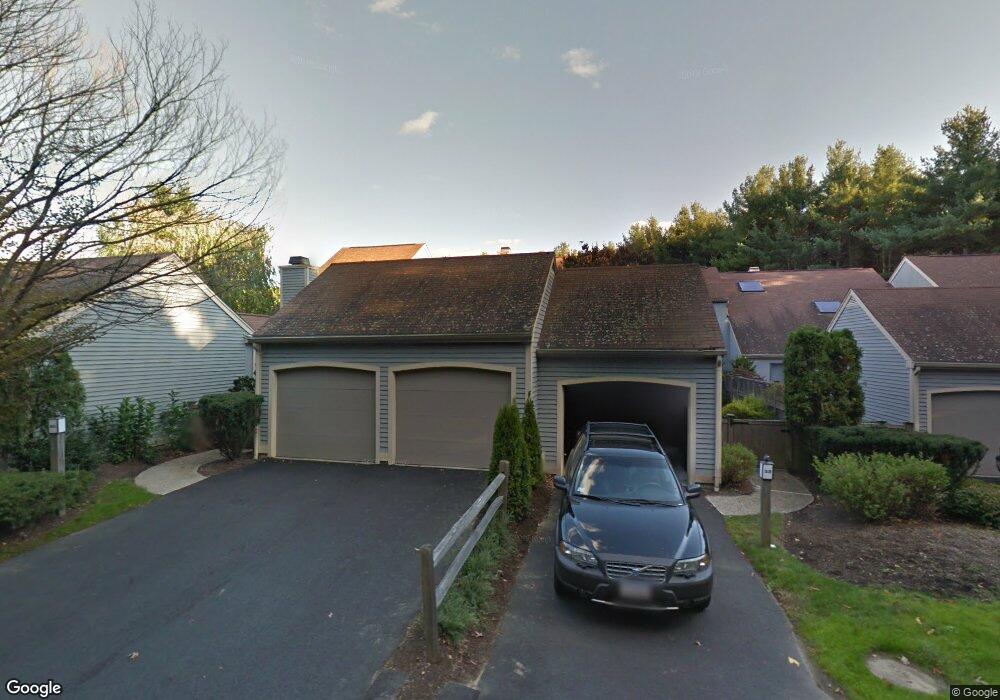
54 Pickwick Way Unit 54P,28 Wayland, MA 01778
Estimated Value: $829,099 - $935,000
2
Beds
2
Baths
1,602
Sq Ft
$552/Sq Ft
Est. Value
About This Home
This home is located at 54 Pickwick Way Unit 54P,28, Wayland, MA 01778 and is currently estimated at $885,025, approximately $552 per square foot. 54 Pickwick Way Unit 54P,28 is a home located in Middlesex County with nearby schools including Wayland High School, Veritas Christian Academy, and The Rivers School.
Ownership History
Date
Name
Owned For
Owner Type
Purchase Details
Closed on
Nov 4, 2024
Sold by
Veno 2Nd Robert H Est and Veno
Bought by
Clayson Robert and Clayson Lois
Current Estimated Value
Home Financials for this Owner
Home Financials are based on the most recent Mortgage that was taken out on this home.
Original Mortgage
$1,905,000
Outstanding Balance
$1,887,785
Interest Rate
6.63%
Mortgage Type
Purchase Money Mortgage
Estimated Equity
-$1,002,760
Purchase Details
Closed on
Oct 16, 1997
Sold by
Sulkin Harvey P and Sulkin Francine
Bought by
Seltzer Larry A and Seltzer Gloria D
Purchase Details
Closed on
Dec 1, 1989
Sold by
Green Company Inc
Bought by
Sulkin Harvey P
Create a Home Valuation Report for This Property
The Home Valuation Report is an in-depth analysis detailing your home's value as well as a comparison with similar homes in the area
Home Values in the Area
Average Home Value in this Area
Purchase History
| Date | Buyer | Sale Price | Title Company |
|---|---|---|---|
| Clayson Robert | $900,000 | None Available | |
| Clayson Robert | $900,000 | None Available | |
| Seltzer Larry A | $411,500 | -- | |
| Seltzer Larry A | $411,500 | -- | |
| Sulkin Harvey P | $341,000 | -- | |
| Sulkin Harvey P | $341,000 | -- |
Source: Public Records
Mortgage History
| Date | Status | Borrower | Loan Amount |
|---|---|---|---|
| Open | Clayson Robert | $1,905,000 | |
| Closed | Clayson Robert | $1,905,000 | |
| Previous Owner | Sulkin Harvey P | $408,800 | |
| Previous Owner | Sulkin Harvey P | $257,900 |
Source: Public Records
Tax History Compared to Growth
Tax History
| Year | Tax Paid | Tax Assessment Tax Assessment Total Assessment is a certain percentage of the fair market value that is determined by local assessors to be the total taxable value of land and additions on the property. | Land | Improvement |
|---|---|---|---|---|
| 2025 | $10,860 | $694,800 | $0 | $694,800 |
| 2024 | $11,500 | $741,000 | $0 | $741,000 |
| 2023 | $11,345 | $681,400 | $0 | $681,400 |
| 2022 | $10,511 | $572,800 | $0 | $572,800 |
| 2021 | $9,308 | $502,600 | $0 | $502,600 |
| 2020 | $9,038 | $508,900 | $0 | $508,900 |
| 2019 | $9,694 | $530,300 | $0 | $530,300 |
| 2018 | $9,042 | $501,500 | $0 | $501,500 |
| 2017 | $8,067 | $444,700 | $0 | $444,700 |
| 2016 | $8,075 | $465,700 | $0 | $465,700 |
| 2015 | $7,823 | $425,400 | $0 | $425,400 |
Source: Public Records
Map
Nearby Homes
- 12 Cutting Cross Way
- 17 Smokey Hill Rd
- 18 Coltsway Unit 18
- 6 Steepletree Ln
- 125 Woodridge Rd
- 9 Christina
- 5 Brook Trail Rd
- 7 Fox Hollow
- 8 Fox Hollow
- 106 Willow Brook Dr Unit 106
- 1601 Wisteria Way
- 1605 Wisteria Way
- 286 Country Dr
- 8 Frost St
- 1004 Wisteria Way
- 11 White Pine Knoll Rd
- 1 Astra Unit 1
- 12 Astra
- 12 Nancy Rd
- 620 South Ave
- 56 Pickwick Way
- 54 Pickwick Way
- 52 Pickwick Way
- 50 Pickwick Way
- 48 Pickwick Way
- 54 Pickwick Way Unit 54
- 46 Pickwick Way
- 44 Pickwick Way
- 44 Pickwick Way Unit 44
- 42 Pickwick Way
- 36 Pickwick Way
- 40 Pickwick Way
- 40 Pickwick Way Unit 400
- 40 Pickwick Way Unit 40
- 38 Pickwick Way
- 34 Pickwick Way
- 30 Pickwick Way
- 30 Pickwick Way Unit 30
- 32 Pickwick Way
- 28 Pickwick Way