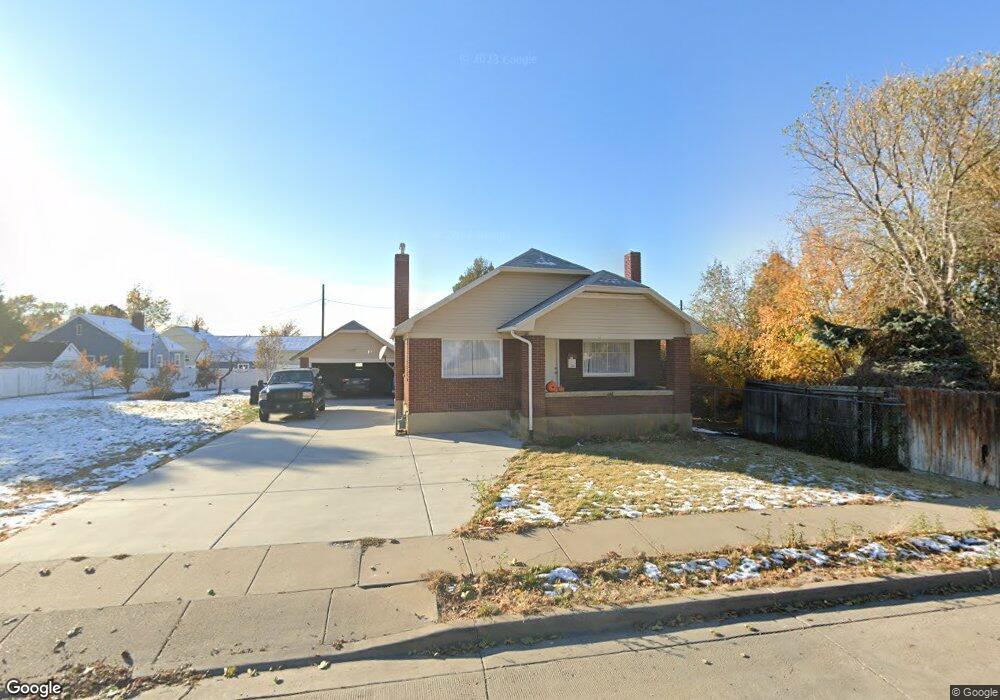
54 S 400 E Bountiful, UT 84010
Estimated Value: $486,000 - $583,000
4
Beds
2
Baths
1,904
Sq Ft
$285/Sq Ft
Est. Value
About This Home
This home is located at 54 S 400 E, Bountiful, UT 84010 and is currently estimated at $543,142, approximately $285 per square foot. 54 S 400 E is a home located in Davis County with nearby schools including Holbrook Elementary School, Millcreek Junior High School, and Bountiful High School.
Ownership History
Date
Name
Owned For
Owner Type
Purchase Details
Closed on
Jul 1, 2022
Sold by
Fiainma and Marrissa
Bought by
Chapin Scott
Current Estimated Value
Purchase Details
Closed on
Feb 26, 2021
Sold by
Nelson Marrissa
Bought by
Fialuma Etimani and Nelson Marrissa
Home Financials for this Owner
Home Financials are based on the most recent Mortgage that was taken out on this home.
Original Mortgage
$205,500
Interest Rate
2.7%
Mortgage Type
New Conventional
Purchase Details
Closed on
Jul 9, 2018
Sold by
Fialuma Etimani and Nelson Marrisa
Bought by
Nelson Marrissa
Purchase Details
Closed on
May 20, 2016
Sold by
Muir Ronald S
Bought by
Fialuma Etimani and Nelson Marrissa
Create a Home Valuation Report for This Property
The Home Valuation Report is an in-depth analysis detailing your home's value as well as a comparison with similar homes in the area
Purchase History
| Date | Buyer | Sale Price | Title Company |
|---|---|---|---|
| Chapin Scott | -- | Homie Title | |
| Fialuma Etimani | -- | Oasis Title Llc | |
| Nelson Marrissa | -- | None Available | |
| Fialuma Etimani | -- | Backman Title | |
| Bingham Linda M | -- | None Available |
Source: Public Records
Mortgage History
| Date | Status | Borrower | Loan Amount |
|---|---|---|---|
| Previous Owner | Fialuma Etimani | $205,500 |
Source: Public Records
Tax History
| Year | Tax Paid | Tax Assessment Tax Assessment Total Assessment is a certain percentage of the fair market value that is determined by local assessors to be the total taxable value of land and additions on the property. | Land | Improvement |
|---|---|---|---|---|
| 2025 | $3,016 | $265,650 | $153,320 | $112,330 |
| 2024 | $2,797 | $255,750 | $143,877 | $111,873 |
| 2023 | $2,685 | $446,000 | $258,242 | $187,758 |
| 2022 | $2,518 | $227,700 | $139,308 | $88,392 |
| 2021 | $2,358 | $328,000 | $182,586 | $145,414 |
| 2020 | $1,972 | $272,000 | $153,553 | $118,447 |
| 2019 | $2,001 | $270,000 | $146,652 | $123,348 |
| 2018 | $1,841 | $243,000 | $143,417 | $99,583 |
| 2016 | $1,552 | $110,550 | $64,017 | $46,533 |
| 2015 | $1,520 | $102,025 | $64,017 | $38,008 |
| 2014 | $1,503 | $104,372 | $64,017 | $40,355 |
| 2013 | -- | $96,160 | $39,595 | $56,565 |
Source: Public Records
Map
Nearby Homes
- 255 E 400 S
- 683 E 100 N
- 698 E 200 S
- 520 S Orchard Dr Unit 17
- 456 E 500 S
- 357 S 100 E
- 453 N 400 E Unit 7-D
- 513 N 400 E Unit 14B
- 275 E Peach Ln S
- 49 E 200 N Unit 4
- 55 E 200 N Unit 2
- 41 E 200 N Unit 6
- 51 E 200 N Unit 3
- 129 N 800 E
- 323 Peach Ln
- 6 N 800 E
- 254 N Main St
- 256 N Main St
- 252 N Main St
- 545 S 100 E
Your Personal Tour Guide
Ask me questions while you tour the home.