Estimated Value: $1,614,209 - $2,091,000
3
Beds
4
Baths
1,662
Sq Ft
$1,092/Sq Ft
Est. Value
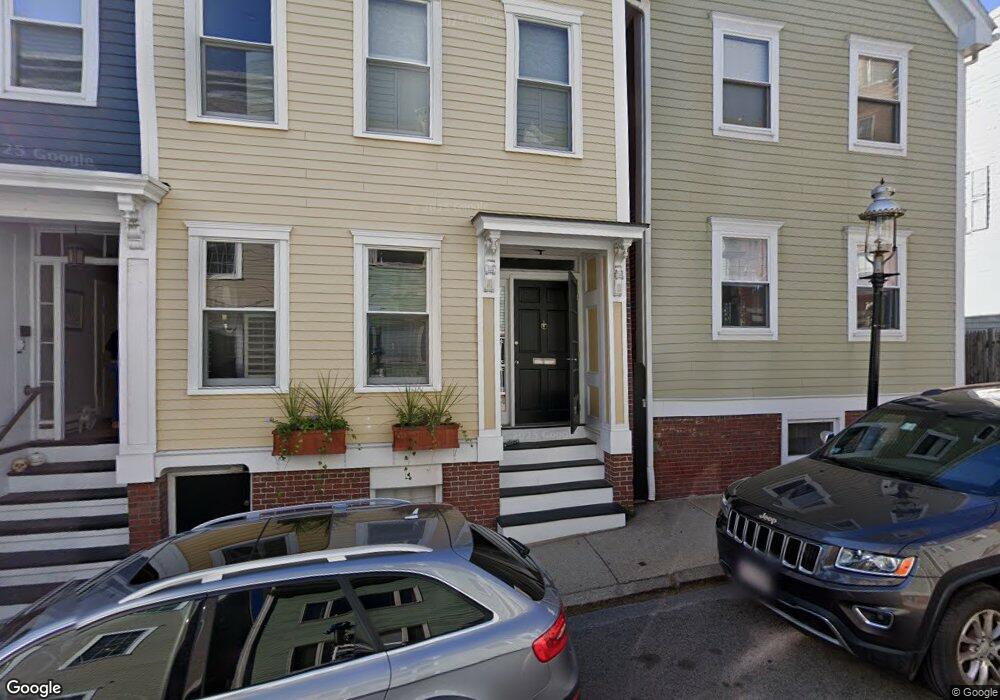
About This Home
This home is located at 54 Soley St, Charlestown, MA 02129 and is currently estimated at $1,814,802, approximately $1,091 per square foot. 54 Soley St is a home located in Suffolk County with nearby schools including Boston Children's School and St John School.
Ownership History
Date
Name
Owned For
Owner Type
Purchase Details
Closed on
Sep 15, 2006
Sold by
Dob Realty Inc
Bought by
Zeikel Jill A
Current Estimated Value
Purchase Details
Closed on
Jun 8, 2006
Sold by
Wallace Julia M and Nickerson William P
Bought by
Dob Realty Inc
Home Financials for this Owner
Home Financials are based on the most recent Mortgage that was taken out on this home.
Original Mortgage
$532,000
Interest Rate
6.62%
Mortgage Type
Purchase Money Mortgage
Create a Home Valuation Report for This Property
The Home Valuation Report is an in-depth analysis detailing your home's value as well as a comparison with similar homes in the area
Home Values in the Area
Average Home Value in this Area
Purchase History
| Date | Buyer | Sale Price | Title Company |
|---|---|---|---|
| Zeikel Jill A | $810,000 | -- | |
| Dob Realty Inc | $400,000 | -- |
Source: Public Records
Mortgage History
| Date | Status | Borrower | Loan Amount |
|---|---|---|---|
| Previous Owner | Dob Realty Inc | $532,000 |
Source: Public Records
Tax History
| Year | Tax Paid | Tax Assessment Tax Assessment Total Assessment is a certain percentage of the fair market value that is determined by local assessors to be the total taxable value of land and additions on the property. | Land | Improvement |
|---|---|---|---|---|
| 2025 | $17,593 | $1,519,300 | $546,700 | $972,600 |
| 2024 | $18,311 | $1,679,900 | $574,900 | $1,105,000 |
| 2023 | $16,705 | $1,555,400 | $532,300 | $1,023,100 |
| 2022 | $15,384 | $1,414,000 | $483,900 | $930,100 |
| 2021 | $15,087 | $1,414,000 | $483,900 | $930,100 |
| 2020 | $13,146 | $1,244,900 | $442,200 | $802,700 |
| 2019 | $12,868 | $1,220,900 | $354,600 | $866,300 |
| 2018 | $11,958 | $1,141,000 | $354,600 | $786,400 |
| 2017 | $11,735 | $1,108,100 | $354,600 | $753,500 |
| 2016 | $10,981 | $998,300 | $354,600 | $643,700 |
| 2015 | $11,101 | $916,700 | $339,000 | $577,700 |
| 2014 | $10,280 | $817,200 | $339,000 | $478,200 |
Source: Public Records
Map
Nearby Homes
- 5 Wallace Ct
- 31 Main St Unit D
- 17 Henley St Unit F
- 47 Harvard St Unit A304
- 12 Prospect St Unit 1
- 46 High St
- 56 High St Unit 3
- 106 Bunker Hill St Unit 2
- 106 Bunker Hill St Unit 4P
- 106 Bunker Hill St Unit 6
- 106 Bunker Hill St Unit 1
- 80 Bunker Hill St Unit 3
- 1 Washington Place
- 6 School St
- 33 Third Ave
- 113 High St Unit 3
- 9 Russell St Unit PH
- 15 Russell St
- 114 Elm St Unit 2
- 20 Sullivan St Unit 2
- 52 Soley St
- 58 Soley St
- 50 Soley St Unit 2
- 50 Soley St Unit 1
- 59 Monument Ave
- 59 Monument Ave Unit 1
- 57 Monument Ave Unit 3
- 57 Monument Ave Unit 2
- 57 Monument Ave Unit 1
- 60 Soley St
- 61 Monument Ave
- 61 Monument Ave Unit 6
- 61 Monument Ave Unit 2
- 61 Monument Ave
- 61 Monument Ave Unit 1
- 48 Soley St
- 53 Monument Ave
- 49 Soley St Unit B
- 49 Soley St
- 49 Soley St Unit 2
Your Personal Tour Guide
Ask me questions while you tour the home.