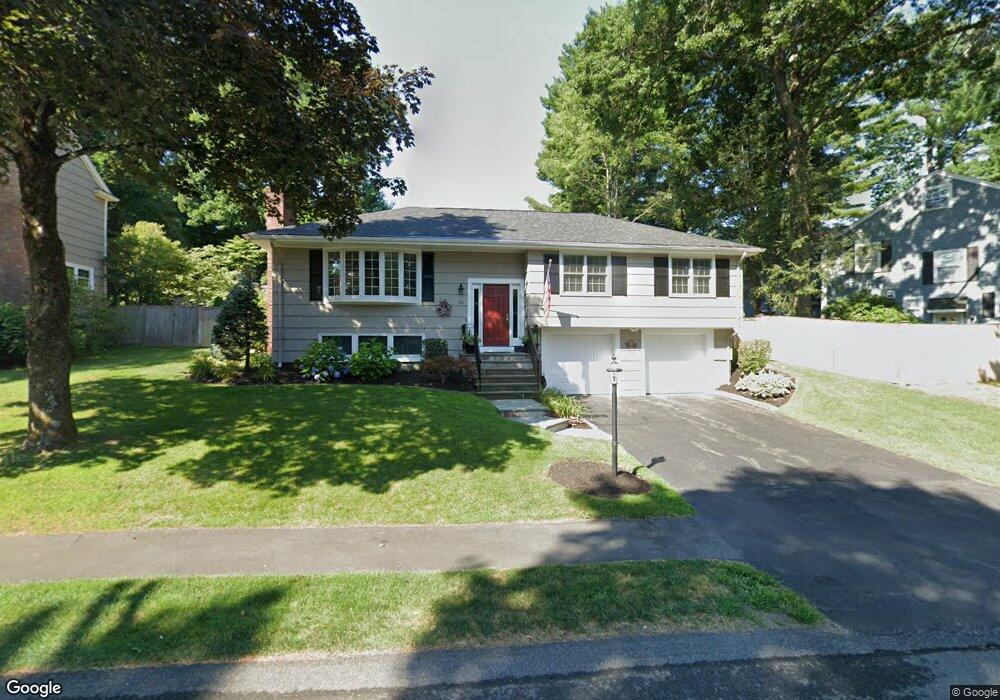
54 Sutton Rd Needham, MA 02492
Estimated Value: $1,504,000 - $1,733,000
4
Beds
3
Baths
2,312
Sq Ft
$697/Sq Ft
Est. Value
About This Home
This home is located at 54 Sutton Rd, Needham, MA 02492 and is currently estimated at $1,611,688, approximately $697 per square foot. 54 Sutton Rd is a home located in Norfolk County with nearby schools including Newman Elementary School, High Rock Middle School, and Pollard Middle School.
Ownership History
Date
Name
Owned For
Owner Type
Purchase Details
Closed on
Apr 24, 2015
Sold by
Patsio George P and Patsio Carol
Bought by
Patsio Carol and Patsio
Current Estimated Value
Purchase Details
Closed on
Jun 17, 2011
Sold by
Patsio Carol
Bought by
Patsio George and Patsio Carol
Home Financials for this Owner
Home Financials are based on the most recent Mortgage that was taken out on this home.
Original Mortgage
$572,000
Interest Rate
4.74%
Mortgage Type
Purchase Money Mortgage
Purchase Details
Closed on
Nov 10, 2008
Sold by
Patsio George P
Bought by
Patsio Carol
Purchase Details
Closed on
Jan 25, 1988
Sold by
Fairbanks Carolyn W
Bought by
Patsio George P
Create a Home Valuation Report for This Property
The Home Valuation Report is an in-depth analysis detailing your home's value as well as a comparison with similar homes in the area
Home Values in the Area
Average Home Value in this Area
Purchase History
| Date | Buyer | Sale Price | Title Company |
|---|---|---|---|
| Patsio Carol | -- | -- | |
| Carol Patsio Ft | -- | -- | |
| Patsio Carol | -- | -- | |
| Patsio George | -- | -- | |
| Patsio George | -- | -- | |
| Patsio George | -- | -- | |
| Patsio Carol | -- | -- | |
| Patsio Carol | -- | -- | |
| Patsio George P | $252,500 | -- |
Source: Public Records
Mortgage History
| Date | Status | Borrower | Loan Amount |
|---|---|---|---|
| Previous Owner | Patsio George | $572,000 | |
| Previous Owner | Patsio George P | $216,000 |
Source: Public Records
Tax History
| Year | Tax Paid | Tax Assessment Tax Assessment Total Assessment is a certain percentage of the fair market value that is determined by local assessors to be the total taxable value of land and additions on the property. | Land | Improvement |
|---|---|---|---|---|
| 2025 | $11,776 | $1,110,900 | $760,200 | $350,700 |
| 2024 | $12,399 | $990,300 | $532,400 | $457,900 |
| 2023 | $12,490 | $957,800 | $532,400 | $425,400 |
| 2022 | $12,078 | $903,400 | $493,200 | $410,200 |
| 2021 | $11,771 | $903,400 | $493,200 | $410,200 |
| 2020 | $11,481 | $919,200 | $493,200 | $426,000 |
| 2019 | $10,727 | $865,800 | $448,700 | $417,100 |
| 2018 | $10,286 | $865,800 | $448,700 | $417,100 |
| 2017 | $9,726 | $818,000 | $448,700 | $369,300 |
| 2016 | $9,440 | $818,000 | $448,700 | $369,300 |
| 2015 | $9,235 | $818,000 | $448,700 | $369,300 |
| 2014 | $9,006 | $773,700 | $408,200 | $365,500 |
Source: Public Records
Map
Nearby Homes
- 1011 Webster St
- 90 Norfolk St
- 233 Warren St
- 120 Wildwood Dr
- 26 Pinewood Rd
- 47 Emerson Rd
- 40 Otis St Unit L
- 53 Heather Ln
- 73 Maple St Unit 1
- 287 High Rock St
- 178 South St
- 193 Garden St
- 78 Birds Hill Ave
- 19 Highland Ct Unit 19
- 638 Webster St
- 638 Webster St Unit 638
- 957 South St
- 24 Deerfield Rd
- 37 Cottage Cir
- 37 Cottage Cir Unit 37