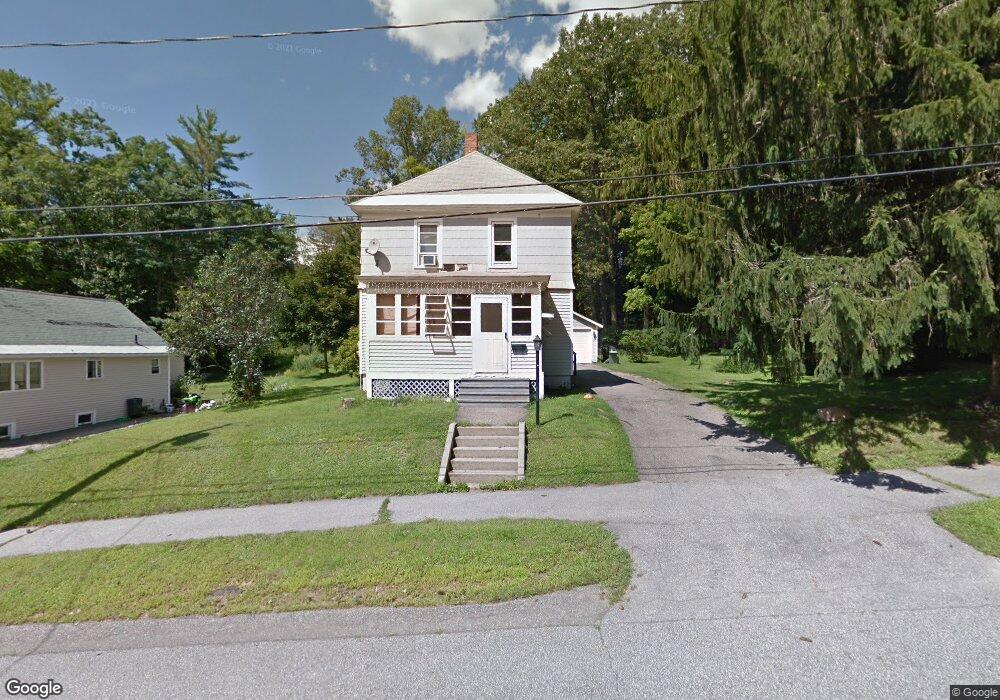
54 Walker St Laconia, NH 03246
Estimated Value: $333,000 - $354,000
3
Beds
1
Bath
1,288
Sq Ft
$267/Sq Ft
Est. Value
About This Home
This home is located at 54 Walker St, Laconia, NH 03246 and is currently estimated at $344,328, approximately $267 per square foot. 54 Walker St is a home located in Belknap County with nearby schools including Laconia Middle School, Laconia High School, and Holy Trinity Catholic School.
Ownership History
Date
Name
Owned For
Owner Type
Purchase Details
Closed on
Sep 5, 2001
Sold by
Lamirande Dorothy A
Bought by
Wentworth Brian W and Wentworth Kelly A
Current Estimated Value
Home Financials for this Owner
Home Financials are based on the most recent Mortgage that was taken out on this home.
Original Mortgage
$114,991
Outstanding Balance
$45,036
Interest Rate
7.05%
Estimated Equity
$299,292
Purchase Details
Closed on
Oct 25, 1996
Sold by
Katrine P Crain T
Bought by
Lamirande Dorothy A
Home Financials for this Owner
Home Financials are based on the most recent Mortgage that was taken out on this home.
Original Mortgage
$68,916
Interest Rate
8.22%
Create a Home Valuation Report for This Property
The Home Valuation Report is an in-depth analysis detailing your home's value as well as a comparison with similar homes in the area
Home Values in the Area
Average Home Value in this Area
Purchase History
| Date | Buyer | Sale Price | Title Company |
|---|---|---|---|
| Wentworth Brian W | $115,900 | -- | |
| Lamirande Dorothy A | $68,500 | -- |
Source: Public Records
Mortgage History
| Date | Status | Borrower | Loan Amount |
|---|---|---|---|
| Open | Lamirande Dorothy A | $114,991 | |
| Previous Owner | Lamirande Dorothy A | $68,916 |
Source: Public Records
Tax History Compared to Growth
Tax History
| Year | Tax Paid | Tax Assessment Tax Assessment Total Assessment is a certain percentage of the fair market value that is determined by local assessors to be the total taxable value of land and additions on the property. | Land | Improvement |
|---|---|---|---|---|
| 2024 | $3,702 | $271,600 | $139,300 | $132,300 |
| 2023 | $3,553 | $255,400 | $127,700 | $127,700 |
| 2022 | $3,242 | $218,300 | $108,400 | $109,900 |
| 2021 | $3,202 | $169,800 | $70,500 | $99,300 |
| 2020 | $3,141 | $159,300 | $60,000 | $99,300 |
| 2019 | $3,334 | $161,900 | $54,800 | $107,100 |
| 2018 | $3,303 | $158,400 | $53,200 | $105,200 |
| 2017 | $2,908 | $138,300 | $52,200 | $86,100 |
| 2016 | $3,079 | $138,700 | $52,200 | $86,500 |
| 2015 | $3,139 | $141,400 | $54,900 | $86,500 |
| 2014 | $3,118 | $139,200 | $54,700 | $84,500 |
| 2013 | $3,010 | $136,300 | $51,800 | $84,500 |
Source: Public Records
Map
Nearby Homes