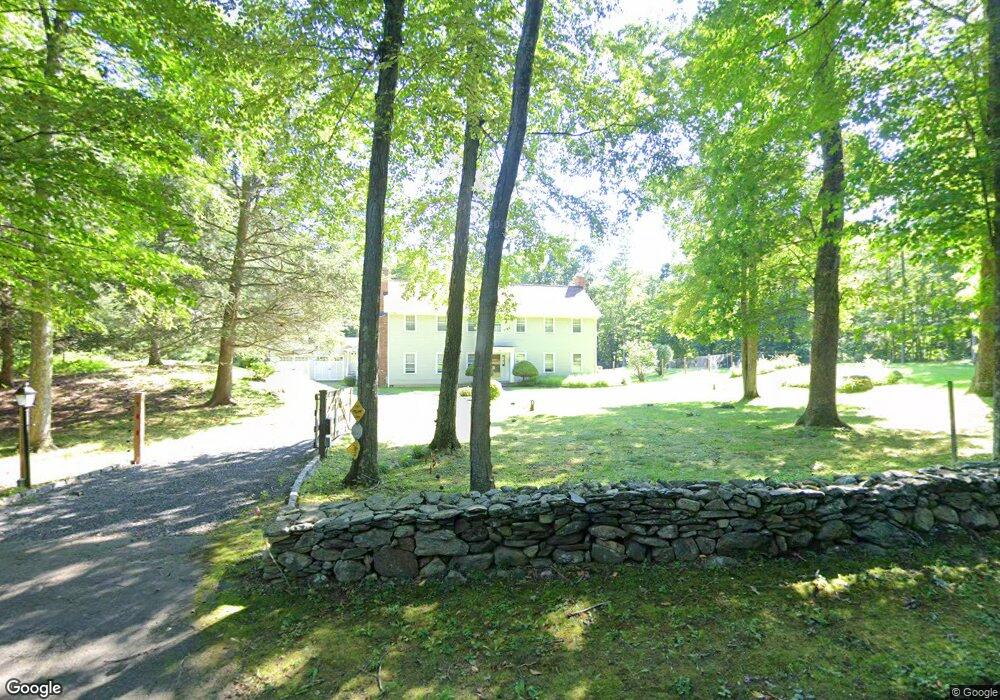
54 Wayside Ln Redding, CT 06896
Estimated Value: $1,120,000 - $1,373,000
3
Beds
4
Baths
3,988
Sq Ft
$307/Sq Ft
Est. Value
About This Home
This home is located at 54 Wayside Ln, Redding, CT 06896 and is currently estimated at $1,224,198, approximately $306 per square foot. 54 Wayside Ln is a home located in Fairfield County with nearby schools including Redding Elementary School, John Read Middle School, and Joel Barlow High School.
Ownership History
Date
Name
Owned For
Owner Type
Purchase Details
Closed on
Sep 22, 2011
Sold by
Castagna Elizabeth W
Bought by
Castagna Elizabeth W and Castagna Matthew D
Current Estimated Value
Purchase Details
Closed on
Sep 21, 2011
Sold by
Castagna Matthew D and Castagna Elizabeth W
Bought by
Castagna Elizabeth W
Purchase Details
Closed on
Oct 2, 2000
Sold by
Piantedosi Gary G and Piantedosi Lisa
Bought by
Castagna Matthew D and Castagna Elizabeth W
Purchase Details
Closed on
May 29, 1997
Sold by
Thurston Harriet J
Bought by
Piantedosi Gary G and Piantedosi Lisa
Home Financials for this Owner
Home Financials are based on the most recent Mortgage that was taken out on this home.
Original Mortgage
$352,000
Interest Rate
7.63%
Mortgage Type
Unknown
Purchase Details
Closed on
Jul 3, 1991
Sold by
Est Levine Grace F
Bought by
Scott Dale and Thurston Harriet J
Create a Home Valuation Report for This Property
The Home Valuation Report is an in-depth analysis detailing your home's value as well as a comparison with similar homes in the area
Home Values in the Area
Average Home Value in this Area
Purchase History
| Date | Buyer | Sale Price | Title Company |
|---|---|---|---|
| Castagna Elizabeth W | -- | -- | |
| Castagna Elizabeth W | -- | -- | |
| Castagna Matthew D | $583,000 | -- | |
| Piantedosi Gary G | $440,000 | -- | |
| Scott Dale | $320,000 | -- |
Source: Public Records
Mortgage History
| Date | Status | Borrower | Loan Amount |
|---|---|---|---|
| Previous Owner | Scott Dale | $350,000 | |
| Previous Owner | Scott Dale | $352,000 |
Source: Public Records
Tax History
| Year | Tax Paid | Tax Assessment Tax Assessment Total Assessment is a certain percentage of the fair market value that is determined by local assessors to be the total taxable value of land and additions on the property. | Land | Improvement |
|---|---|---|---|---|
| 2025 | $19,281 | $652,700 | $173,000 | $479,700 |
| 2024 | $18,746 | $652,700 | $173,000 | $479,700 |
| 2023 | $18,073 | $652,700 | $173,000 | $479,700 |
| 2022 | $16,920 | $507,500 | $170,900 | $336,600 |
| 2021 | $9,128 | $507,500 | $170,900 | $336,600 |
| 2020 | $16,666 | $507,500 | $170,900 | $336,600 |
| 2019 | $9,289 | $507,500 | $170,900 | $336,600 |
| 2018 | $16,098 | $507,500 | $170,900 | $336,600 |
| 2017 | $18,504 | $624,700 | $241,400 | $383,300 |
| 2016 | $18,266 | $624,700 | $241,400 | $383,300 |
| 2015 | $18,060 | $624,700 | $241,400 | $383,300 |
| 2014 | $18,060 | $624,700 | $241,400 | $383,300 |
Source: Public Records
Map
Nearby Homes
- 299 Redding Rd
- 74 Seventy Acre Rd
- 22 Ledgewood Rd
- 45 Great Pasture Rd
- 229 Umpawaug Rd
- 64 Portland Ave
- 7 Peaceable St
- 41 Deer Hill Rd
- 15 Laurel Hill Rd
- 26 Wilridge Rd
- 0 Mountain Rd
- 2 Brick School Dr
- 20 Mountain Rd
- 852 Danbury Rd
- 0 Old Mill Rd
- 24 Costa Ln
- 2 Longwood Dr
- 96 Georgetown Rd
- 00 Old Mill Rd
- 25 Eustis Ln
Your Personal Tour Guide
Ask me questions while you tour the home.