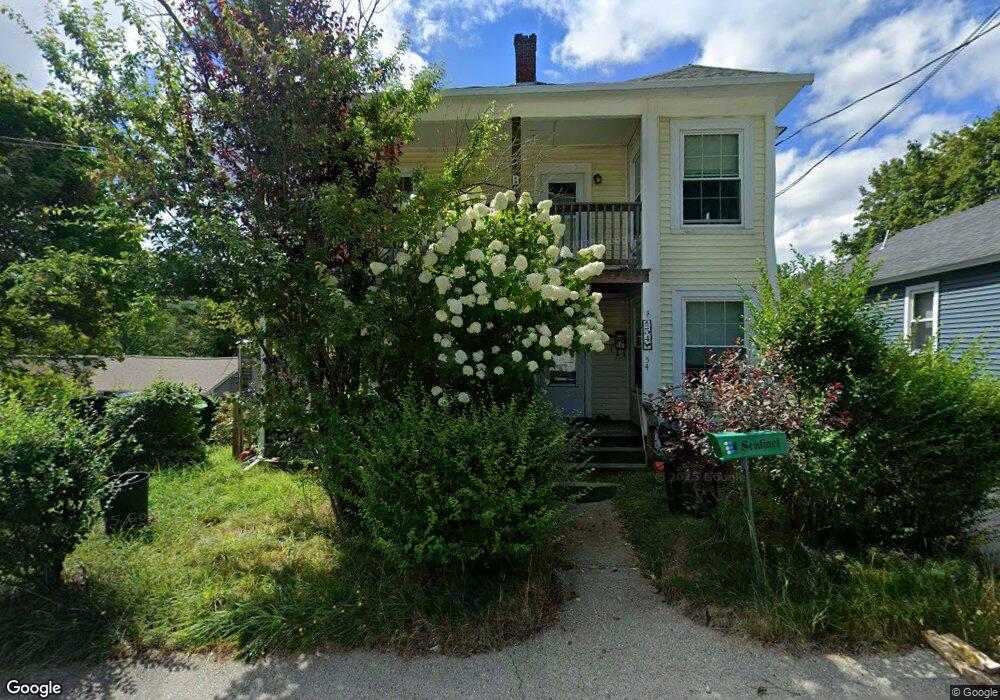
54 Webster St Jaffrey, NH 03452
Estimated Value: $325,000 - $341,000
4
Beds
2
Baths
2,106
Sq Ft
$158/Sq Ft
Est. Value
About This Home
This home is located at 54 Webster St, Jaffrey, NH 03452 and is currently estimated at $332,258, approximately $157 per square foot. 54 Webster St is a home located in Cheshire County with nearby schools including Jaffrey Grade School, Conant Middle High School, and Conant High School.
Ownership History
Date
Name
Owned For
Owner Type
Purchase Details
Closed on
Nov 4, 2021
Sold by
Duval Edward T and Duval Stephanie A
Bought by
Porokhina Alexandra O
Current Estimated Value
Home Financials for this Owner
Home Financials are based on the most recent Mortgage that was taken out on this home.
Original Mortgage
$192,000
Outstanding Balance
$173,778
Interest Rate
2.88%
Mortgage Type
Purchase Money Mortgage
Estimated Equity
$158,480
Purchase Details
Closed on
Jul 13, 2001
Sold by
Peck Nickie A
Bought by
Duval Edward T and Duval Stephanie A
Home Financials for this Owner
Home Financials are based on the most recent Mortgage that was taken out on this home.
Original Mortgage
$93,531
Interest Rate
7.2%
Create a Home Valuation Report for This Property
The Home Valuation Report is an in-depth analysis detailing your home's value as well as a comparison with similar homes in the area
Home Values in the Area
Average Home Value in this Area
Purchase History
| Date | Buyer | Sale Price | Title Company |
|---|---|---|---|
| Porokhina Alexandra O | $240,000 | None Available | |
| Duval Edward T | $95,000 | -- |
Source: Public Records
Mortgage History
| Date | Status | Borrower | Loan Amount |
|---|---|---|---|
| Open | Porokhina Alexandra O | $192,000 | |
| Previous Owner | Duval Edward T | $93,531 |
Source: Public Records
Tax History
| Year | Tax Paid | Tax Assessment Tax Assessment Total Assessment is a certain percentage of the fair market value that is determined by local assessors to be the total taxable value of land and additions on the property. | Land | Improvement |
|---|---|---|---|---|
| 2025 | $5,833 | $307,800 | $68,500 | $239,300 |
| 2024 | $5,300 | $161,600 | $25,000 | $136,600 |
| 2023 | $5,389 | $161,600 | $25,000 | $136,600 |
| 2022 | $4,969 | $160,400 | $25,000 | $135,400 |
| 2021 | $4,474 | $160,400 | $25,000 | $135,400 |
| 2020 | $4,416 | $160,400 | $25,000 | $135,400 |
| 2019 | $4,448 | $127,700 | $20,000 | $107,700 |
| 2018 | $4,214 | $127,700 | $20,000 | $107,700 |
| 2017 | $4,190 | $127,100 | $20,000 | $107,100 |
| 2016 | $4,194 | $127,100 | $20,000 | $107,100 |
| 2015 | $4,216 | $126,900 | $20,000 | $106,900 |
| 2014 | $4,272 | $145,052 | $37,914 | $107,138 |
| 2013 | $4,221 | $145,052 | $37,914 | $107,138 |
Source: Public Records
Map
Nearby Homes
- 8 Main St Unit 11
- 8 Cross St
- 94 Fitch Rd
- 4 Meadow Ln
- 23 Coburn Way
- 61 Gilmore Pond Rd
- 49 Prospect St
- 139 Squantum Rd
- 129 Scenic Dr
- 43 Parsons Ln
- 199 Bryant Rd
- 191 Bryant Rd
- 18 Roberts Dr Unit 1
- 65 Roberts Dr Unit 17
- 57 Roberts Dr Unit 19
- 715 Gilmore Pond Rd
- 52 Roberts Dr Unit 5
- 40 Roberts Dr Unit 3
- 56 Roberts Dr Unit 7
- 60 Roberts Dr Unit 8
Your Personal Tour Guide
Ask me questions while you tour the home.