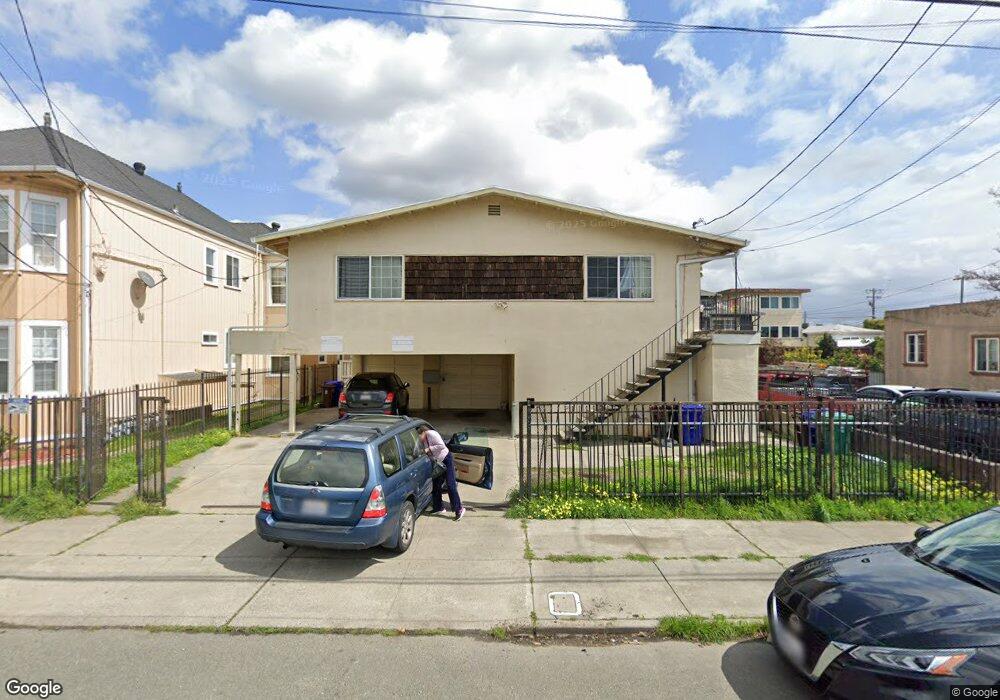
540 20th St Unit 546 Richmond, CA 94801
Belding Woods NeighborhoodEstimated Value: $676,762 - $784,000
--
Bed
--
Bath
3,353
Sq Ft
$223/Sq Ft
Est. Value
About This Home
This home is located at 540 20th St Unit 546, Richmond, CA 94801 and is currently estimated at $746,691, approximately $222 per square foot. 540 20th St Unit 546 is a home located in Contra Costa County with nearby schools including Grant Elementary School, Lovonya DeJean Middle School, and John F. Kennedy High School.
Ownership History
Date
Name
Owned For
Owner Type
Purchase Details
Closed on
Sep 28, 2011
Sold by
Gonzalez Delia
Bought by
Gonzalez Alfredo
Current Estimated Value
Home Financials for this Owner
Home Financials are based on the most recent Mortgage that was taken out on this home.
Original Mortgage
$125,000
Outstanding Balance
$11,810
Interest Rate
4.09%
Mortgage Type
New Conventional
Estimated Equity
$734,881
Purchase Details
Closed on
Feb 26, 2003
Sold by
Robinson Jackie and Robinson Henry
Bought by
Gonzalez Alfredo and Gonzalez Delia
Create a Home Valuation Report for This Property
The Home Valuation Report is an in-depth analysis detailing your home's value as well as a comparison with similar homes in the area
Home Values in the Area
Average Home Value in this Area
Purchase History
| Date | Buyer | Sale Price | Title Company |
|---|---|---|---|
| Gonzalez Alfredo | -- | Old Republic Title Company | |
| Gonzalez Alfredo | $320,000 | First American Title |
Source: Public Records
Mortgage History
| Date | Status | Borrower | Loan Amount |
|---|---|---|---|
| Open | Gonzalez Alfredo | $125,000 |
Source: Public Records
Tax History Compared to Growth
Tax History
| Year | Tax Paid | Tax Assessment Tax Assessment Total Assessment is a certain percentage of the fair market value that is determined by local assessors to be the total taxable value of land and additions on the property. | Land | Improvement |
|---|---|---|---|---|
| 2025 | $11,263 | $463,446 | $223,035 | $240,411 |
| 2024 | $10,888 | $454,360 | $218,662 | $235,698 |
| 2023 | $10,888 | $445,452 | $214,375 | $231,077 |
| 2022 | $10,582 | $436,719 | $210,172 | $226,547 |
| 2021 | $10,355 | $428,156 | $206,051 | $222,105 |
| 2019 | $9,678 | $415,459 | $199,941 | $215,518 |
| 2018 | $9,305 | $407,314 | $196,021 | $211,293 |
| 2017 | $9,035 | $399,328 | $192,178 | $207,150 |
| 2016 | $8,844 | $391,499 | $188,410 | $203,089 |
| 2015 | $8,711 | $385,619 | $185,580 | $200,039 |
| 2014 | $8,035 | $340,000 | $163,600 | $176,400 |
Source: Public Records
Map
Nearby Homes