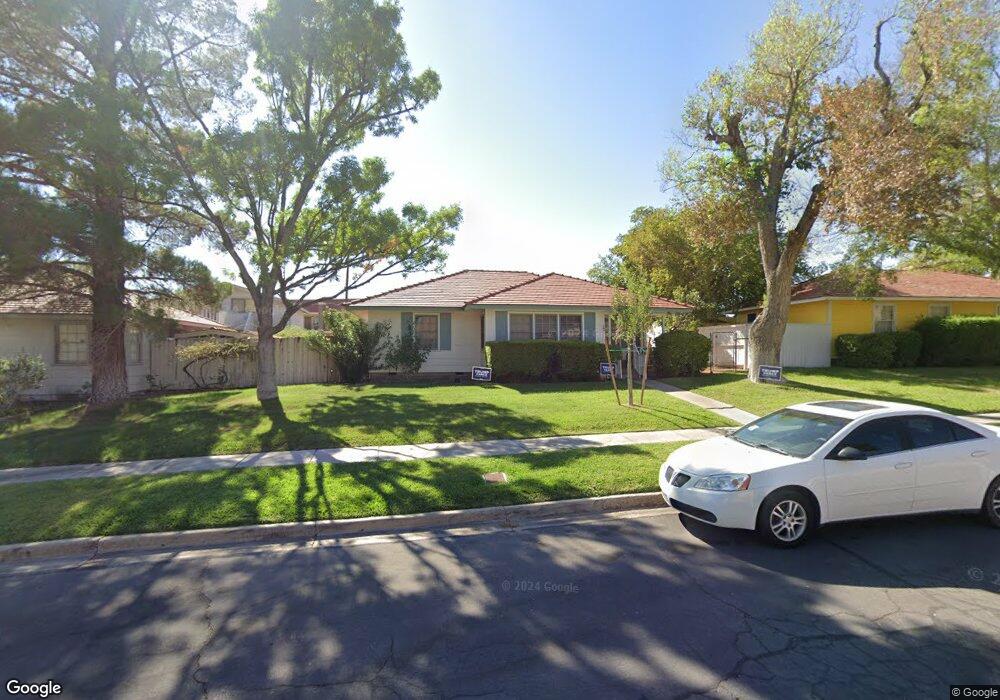
540 Cherry St Boulder City, NV 89005
Estimated Value: $407,000 - $496,000
3
Beds
1
Bath
1,168
Sq Ft
$373/Sq Ft
Est. Value
About This Home
This home is located at 540 Cherry St, Boulder City, NV 89005 and is currently estimated at $436,210, approximately $373 per square foot. 540 Cherry St is a home located in Clark County with nearby schools including Andrew Mitchell Elementary School, Martha P. King Elementary School, and Elton M. & Madelaine E. Garrett Junior High School.
Ownership History
Date
Name
Owned For
Owner Type
Purchase Details
Closed on
Aug 3, 2023
Sold by
William C And Barbara J Conklin Family T
Bought by
Conklin Exemption Trust and Conklin
Current Estimated Value
Purchase Details
Closed on
Jul 31, 2015
Sold by
Edmiston William L and Conklin Barbara J
Bought by
William C And Barbara J Conklin Family
Purchase Details
Closed on
Aug 19, 2011
Sold by
Mooney George and Mooney Alice
Bought by
Mooney George W and Mooney Exemption Trust
Create a Home Valuation Report for This Property
The Home Valuation Report is an in-depth analysis detailing your home's value as well as a comparison with similar homes in the area
Home Values in the Area
Average Home Value in this Area
Purchase History
| Date | Buyer | Sale Price | Title Company |
|---|---|---|---|
| Conklin Exemption Trust | -- | None Listed On Document | |
| William C And Barbara J Conklin Family | -- | None Available | |
| Mooney George W | -- | None Available |
Source: Public Records
Tax History
| Year | Tax Paid | Tax Assessment Tax Assessment Total Assessment is a certain percentage of the fair market value that is determined by local assessors to be the total taxable value of land and additions on the property. | Land | Improvement |
|---|---|---|---|---|
| 2026 | $1,109 | $72,761 | $55,650 | $17,111 |
| 2024 | $1,045 | $66,047 | $49,000 | $17,047 |
| 2023 | $1,045 | $52,118 | $36,750 | $15,368 |
| 2022 | $968 | $46,998 | $33,250 | $13,748 |
| 2021 | $896 | $43,224 | $30,450 | $12,774 |
| 2020 | $832 | $41,133 | $28,700 | $12,433 |
| 2019 | $780 | $38,244 | $26,250 | $11,994 |
| 2018 | $744 | $34,009 | $22,750 | $11,259 |
| 2017 | $840 | $32,152 | $21,000 | $11,152 |
| 2016 | $704 | $27,119 | $15,750 | $11,369 |
| 2015 | $703 | $26,755 | $15,750 | $11,005 |
| 2014 | $689 | $26,501 | $15,750 | $10,751 |
Source: Public Records
Map
Nearby Homes
Your Personal Tour Guide
Ask me questions while you tour the home.