Estimated Value: $602,000 - $707,000
3
Beds
2
Baths
1,789
Sq Ft
$371/Sq Ft
Est. Value
About This Home
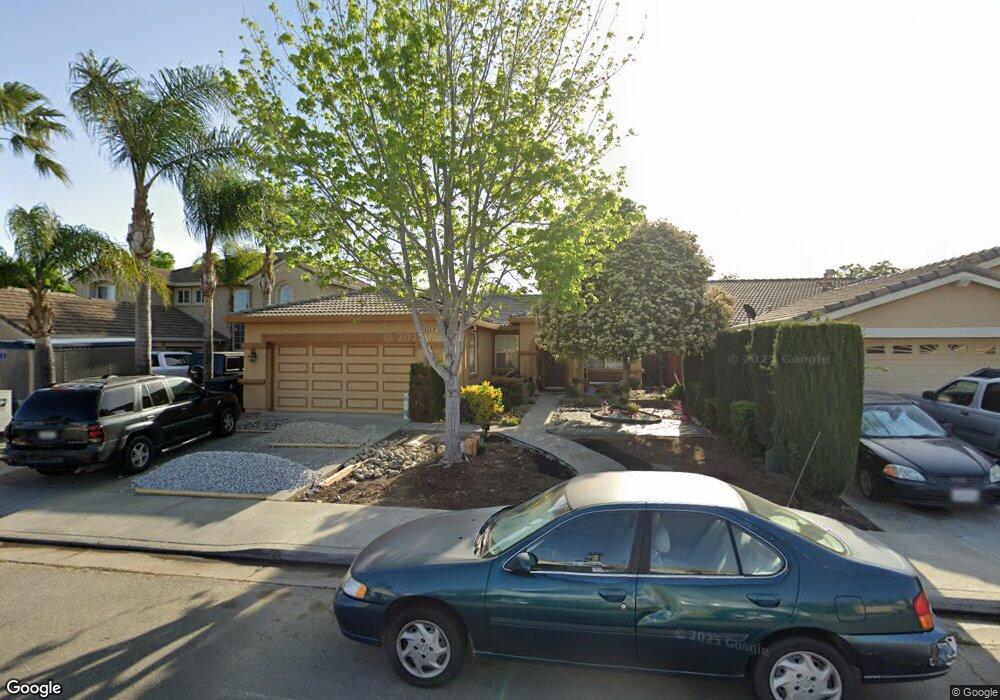
This home is located at 540 Clarence Bromell St, Tracy, CA 95377 and is currently estimated at $663,542, approximately $370 per square foot. 540 Clarence Bromell St is a home located in San Joaquin County with nearby schools including George Kelly Elementary School, John C. Kimball High School, and Tracy Independent Study Charter School.
Ownership History
Date
Name
Owned For
Owner Type
Purchase Details
Closed on
Jul 1, 2003
Sold by
Vanphan Viet
Bought by
Walsh Michael and Walsh Olga
Current Estimated Value
Home Financials for this Owner
Home Financials are based on the most recent Mortgage that was taken out on this home.
Original Mortgage
$256,000
Outstanding Balance
$108,838
Interest Rate
5.26%
Mortgage Type
Purchase Money Mortgage
Estimated Equity
$554,704
Purchase Details
Closed on
Feb 13, 2002
Sold by
Ho Ka Y
Bought by
Vanvanphan Viet Van
Home Financials for this Owner
Home Financials are based on the most recent Mortgage that was taken out on this home.
Original Mortgage
$282,600
Interest Rate
8.6%
Purchase Details
Closed on
May 24, 2001
Sold by
Meritage Homes Of Northern California In
Bought by
Ho Ka Y
Home Financials for this Owner
Home Financials are based on the most recent Mortgage that was taken out on this home.
Original Mortgage
$270,797
Interest Rate
7.15%
Mortgage Type
Stand Alone First
Create a Home Valuation Report for This Property
The Home Valuation Report is an in-depth analysis detailing your home's value as well as a comparison with similar homes in the area
Home Values in the Area
Average Home Value in this Area
Purchase History
| Date | Buyer | Sale Price | Title Company |
|---|---|---|---|
| Walsh Michael | $320,000 | Alliance Title Company | |
| Vanvanphan Viet Van | $314,000 | Financial Title Company | |
| Ho Ka Y | $271,000 | North American Title Co |
Source: Public Records
Mortgage History
| Date | Status | Borrower | Loan Amount |
|---|---|---|---|
| Open | Walsh Michael | $256,000 | |
| Previous Owner | Vanvanphan Viet Van | $282,600 | |
| Previous Owner | Ho Ka Y | $270,797 |
Source: Public Records
Tax History Compared to Growth
Tax History
| Year | Tax Paid | Tax Assessment Tax Assessment Total Assessment is a certain percentage of the fair market value that is determined by local assessors to be the total taxable value of land and additions on the property. | Land | Improvement |
|---|---|---|---|---|
| 2025 | $6,614 | $454,948 | $136,484 | $318,464 |
| 2024 | $6,166 | $446,028 | $133,808 | $312,220 |
| 2023 | $6,057 | $437,284 | $131,185 | $306,099 |
| 2022 | $6,203 | $428,711 | $128,613 | $300,098 |
| 2021 | $6,103 | $420,306 | $126,092 | $294,214 |
| 2020 | $6,042 | $415,998 | $124,800 | $291,198 |
| 2019 | $5,938 | $407,842 | $122,353 | $285,489 |
| 2018 | $5,818 | $399,846 | $119,954 | $279,892 |
| 2017 | $5,569 | $392,006 | $117,602 | $274,404 |
| 2016 | $5,593 | $384,320 | $115,296 | $269,024 |
| 2014 | $5,051 | $350,000 | $105,000 | $245,000 |
Source: Public Records
Map
Nearby Homes
- 485 Cape Breton Ln
- 2172 Golden Gate Dr
- 2132 Tennis Ln
- 790 Everglades Ln
- 2335 Cypress Dr
- 1990 Harvest Landing Ct
- 8300 W 11th St
- 550 Fawn Glen Dr
- 655 Alden Glen Dr
- 265 Quail Meadows Ln
- 1590 Doe Trail Ln
- 1005 Wood Thrush Ln
- 423 Riley Ct
- 1150 Palomar Ct
- 1830 Laurelgrove Ln
- 1750 Laurelgrove Ln
- 2280 Gibralter Ln
- 1460 Tennis Ln
- 313 Michael Cox Ln
- 500 Chestnut Ave
- 560 Clarence Bromell St
- 520 Clarence Bromell St
- 510 Clarence Bromell St
- 580 Clarence Bromell St
- 500 Clarence Bromell St
- 541 Clarence Bromell St
- 561 Clarence Bromell St
- 521 Clarence Bromell St
- 581 Clarence Bromell St
- 590 Clarence Bromell St
- 490 Clarence Bromell St
- 501 Clarence Bromell St
- 491 Clarence Bromell St
- 2045 Olympic Ave
- 480 Clarence Bromell St
- 500 N Corral Hollow Rd
- 2055 Olympic Ave
- 542 Banff Ct
- 562 Banff Ct
- 481 Clarence Bromell St