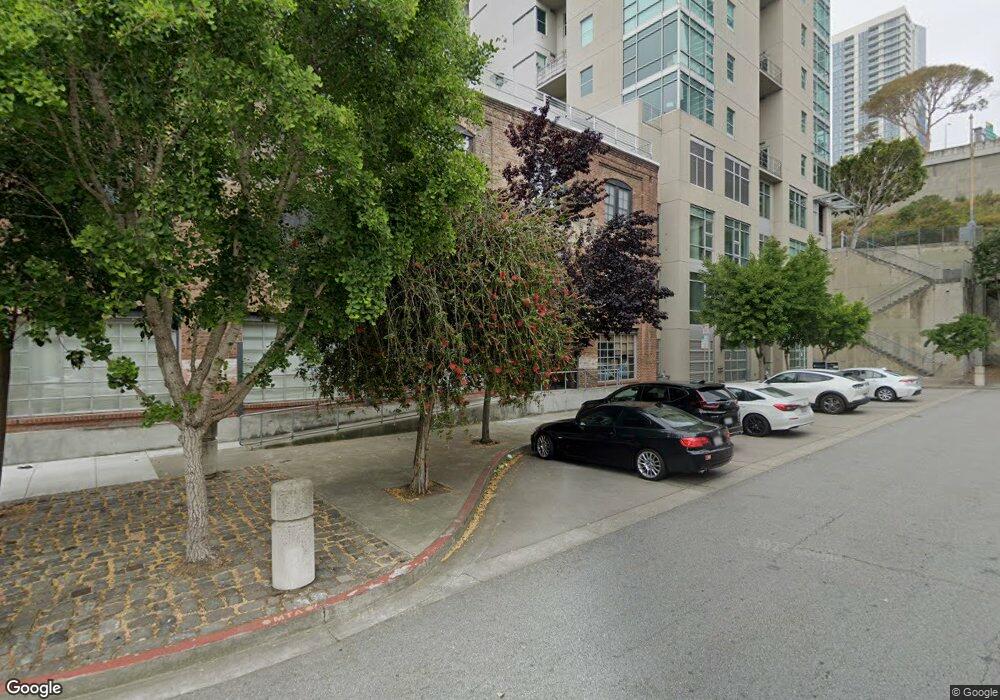
540 Delancey St Unit 304 San Francisco, CA 94107
South Beach NeighborhoodEstimated Value: $968,000 - $1,180,000
1
Bed
1
Bath
1,179
Sq Ft
$900/Sq Ft
Est. Value
About This Home
This home is located at 540 Delancey St Unit 304, San Francisco, CA 94107 and is currently estimated at $1,060,984, approximately $899 per square foot. 540 Delancey St Unit 304 is a home located in San Francisco County with nearby schools including Daniel Webster Elementary School, James Lick Middle School, and Five Keys Charter School.
Ownership History
Date
Name
Owned For
Owner Type
Purchase Details
Closed on
Apr 13, 2016
Sold by
Fedorovici Adrian
Bought by
Fedorovici Adrian
Current Estimated Value
Purchase Details
Closed on
Apr 8, 2015
Sold by
Goldman Lawrence
Bought by
Fedorovici Adrian
Home Financials for this Owner
Home Financials are based on the most recent Mortgage that was taken out on this home.
Original Mortgage
$700,000
Interest Rate
3.86%
Mortgage Type
New Conventional
Purchase Details
Closed on
Mar 17, 2011
Sold by
Friedheim Amy
Bought by
Friedheim Amy
Purchase Details
Closed on
Jun 11, 2002
Sold by
Deputy David
Bought by
Friedheim Amy
Home Financials for this Owner
Home Financials are based on the most recent Mortgage that was taken out on this home.
Original Mortgage
$312,500
Interest Rate
6.86%
Mortgage Type
Stand Alone First
Purchase Details
Closed on
Oct 30, 1997
Sold by
Cape Horn Investment Llc
Bought by
Deputy David
Home Financials for this Owner
Home Financials are based on the most recent Mortgage that was taken out on this home.
Original Mortgage
$319,360
Interest Rate
6.87%
Mortgage Type
Purchase Money Mortgage
Create a Home Valuation Report for This Property
The Home Valuation Report is an in-depth analysis detailing your home's value as well as a comparison with similar homes in the area
Home Values in the Area
Average Home Value in this Area
Purchase History
| Date | Buyer | Sale Price | Title Company |
|---|---|---|---|
| Fedorovici Adrian | -- | None Available | |
| Fedorovici Adrian | $1,335,000 | Fidelity National Title Co | |
| Friedheim Amy | -- | None Available | |
| Friedheim Amy | $595,000 | Fidelity National Title Co | |
| Deputy David | $399,500 | Fidelity National Title Co |
Source: Public Records
Mortgage History
| Date | Status | Borrower | Loan Amount |
|---|---|---|---|
| Previous Owner | Fedorovici Adrian | $700,000 | |
| Previous Owner | Friedheim Amy | $312,500 | |
| Previous Owner | Deputy David | $319,360 |
Source: Public Records
Tax History Compared to Growth
Tax History
| Year | Tax Paid | Tax Assessment Tax Assessment Total Assessment is a certain percentage of the fair market value that is determined by local assessors to be the total taxable value of land and additions on the property. | Land | Improvement |
|---|---|---|---|---|
| 2025 | $19,497 | $1,256,000 | $628,000 | $628,000 |
| 2024 | $19,497 | $1,549,380 | $774,690 | $774,690 |
| 2023 | $17,202 | $1,350,000 | $675,000 | $675,000 |
| 2022 | $18,817 | $1,489,216 | $744,608 | $744,608 |
| 2021 | $18,469 | $1,460,016 | $730,008 | $730,008 |
| 2020 | $18,531 | $1,445,046 | $722,523 | $722,523 |
| 2019 | $17,907 | $1,416,712 | $708,356 | $708,356 |
| 2018 | $17,287 | $1,388,934 | $694,467 | $694,467 |
| 2017 | $16,777 | $1,361,700 | $680,850 | $680,850 |
| 2016 | $16,516 | $1,335,000 | $667,500 | $667,500 |
| 2015 | $12,792 | $1,019,980 | $509,990 | $509,990 |
| 2014 | $8,820 | $717,032 | $358,516 | $358,516 |
Source: Public Records
Map
Nearby Homes
- 200 Brannan St Unit 208
- 1 Federal St Unit 12
- 229 Brannan St Unit 12C
- 229 Brannan St Unit 15A
- 229 Brannan St Unit 2C
- 219 Brannan St Unit 10H
- 219 Brannan St Unit 5G
- 301 Bryant St Unit 601
- 239 Brannan St Unit 14A
- 72 Townsend St Unit 806
- 461 2nd St Unit 461T
- 461 2nd St Unit 558T
- 461 2nd St Unit 302C
- 401 Harrison St Unit 44A
- 401 Harrison St Unit 6C
- 401 Harrison St Unit 31D
- 401 Harrison St Unit 46B
- 88 Townsend St Unit P-140
- 414 Bryant St
- 425 1st St Unit 1307
- 540 Delancey St Unit 402-3
- 540 Delancey St Unit 301
- 540 Delancey St Unit 103
- 540 Delancey St Unit 102
- 540 Delancey St Unit 101
- 540 Delancey St Unit 403
- 540 Delancey St Unit 402
- 540 Delancey St Unit 401
- 540 Delancey St Unit 305
- 540 Delancey St Unit 303
- 540 Delancey St Unit 302
- 540 Delancey St Unit 204
- 540 Delancey St Unit 203
- 540 Delancey St Unit 202
- 540 Delancey St Unit 201
- 301 Bryant St Unit 22D
- 301 Bryant St Unit 24D
- 301 Bryant St Unit D11
- 301 Bryant St
- 301 Bryant St Unit 702