Estimated Value: $403,508 - $437,000
4
Beds
3
Baths
2,442
Sq Ft
$172/Sq Ft
Est. Value
About This Home
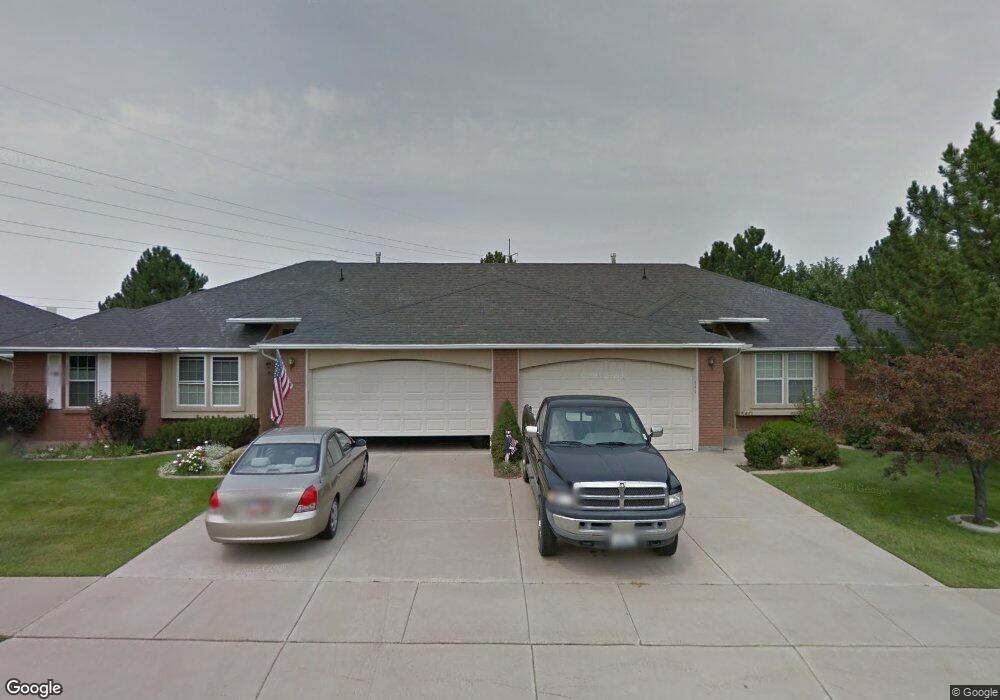
This home is located at 540 E 5400 S, Ogden, UT 84405 and is currently estimated at $418,877, approximately $171 per square foot. 540 E 5400 S is a home located in Weber County with nearby schools including H Guy Child School, South Ogden Junior High School, and Bonneville High School.
Ownership History
Date
Name
Owned For
Owner Type
Purchase Details
Closed on
Feb 13, 2024
Sold by
Balmer Ruth
Bought by
Ruth Esther Balmer Revocable Living Trust and Balmer
Current Estimated Value
Purchase Details
Closed on
Jul 27, 2021
Sold by
Schmidt Terianne
Bought by
Schmidt Terianne and Terianne Schmidt Living Trust
Purchase Details
Closed on
Feb 13, 2013
Sold by
Anhorn Dale A and Anhorn Peggy R
Bought by
Balmer Ruth
Purchase Details
Closed on
Mar 3, 2011
Sold by
Anhorn Dale A and Anhorn Peggy R
Bought by
Anhorn Dale A and Anhorn Peggy R
Purchase Details
Closed on
May 30, 1996
Sold by
Simmons Russell E and Simmons Nelda
Bought by
Anhorn Dale A and Anhorn Peggy R
Home Financials for this Owner
Home Financials are based on the most recent Mortgage that was taken out on this home.
Original Mortgage
$60,000
Interest Rate
7.97%
Create a Home Valuation Report for This Property
The Home Valuation Report is an in-depth analysis detailing your home's value as well as a comparison with similar homes in the area
Home Values in the Area
Average Home Value in this Area
Purchase History
| Date | Buyer | Sale Price | Title Company |
|---|---|---|---|
| Ruth Esther Balmer Revocable Living Trust | -- | None Listed On Document | |
| Schmidt Terianne | -- | None Available | |
| Balmer Ruth | -- | Us Title Insurance Agency | |
| Anhorn Dale A | -- | None Available | |
| Anhorn Dale A | -- | U S Title |
Source: Public Records
Mortgage History
| Date | Status | Borrower | Loan Amount |
|---|---|---|---|
| Previous Owner | Anhorn Dale A | $60,000 |
Source: Public Records
Tax History
| Year | Tax Paid | Tax Assessment Tax Assessment Total Assessment is a certain percentage of the fair market value that is determined by local assessors to be the total taxable value of land and additions on the property. | Land | Improvement |
|---|---|---|---|---|
| 2025 | $157 | $398,430 | $90,000 | $308,430 |
| 2024 | $150 | $213,400 | $49,500 | $163,900 |
| 2023 | $228 | $212,300 | $49,500 | $162,800 |
| 2022 | $260 | $210,100 | $49,500 | $160,600 |
| 2021 | $185 | $319,000 | $60,000 | $259,000 |
| 2020 | $68 | $259,000 | $40,000 | $219,000 |
| 2019 | $167 | $256,000 | $35,000 | $221,000 |
| 2018 | $179 | $249,000 | $35,000 | $214,000 |
| 2017 | $228 | $213,000 | $35,000 | $178,000 |
| 2016 | $1,446 | $101,750 | $18,150 | $83,600 |
| 2015 | -- | $97,350 | $18,150 | $79,200 |
| 2014 | -- | $90,200 | $18,150 | $72,050 |
Source: Public Records
Map
Nearby Homes
- 5449 S 700 E
- 595 Ben Lomond Ave
- 3688 S Adams Ave
- 3112 S Adams Ave
- 5523 S 700 E
- 571 Ben Lomond Ave
- 5488 S 250 E
- 5142 S 300 E
- 5492 S 825 E
- 5055 Kiwana Dr
- 715 S 350 E Unit 2
- 5540 S 850 E
- 856 E 5575 S
- 889 Ben Lomond Ave
- 5530 S 100 W
- 980 E 5475 S
- 4825 Burch Creek Dr
- 5581 S 100 W
- 977 E 5550 S
- 209 W 5200 S
- 530 E 5400 S
- 5391 S 550 E
- 5381 S 550 E
- 531 E 5350 S
- 531 E 5350 S Unit 3
- 520 E 5400 S Unit 41
- 521 E 5350 S
- 5405 S 550 E
- 541 E 5350 S
- 551 E 5350 S Unit 11
- 511 E 5350 S
- 510 E 5400 S Unit 42
- 5380 S 550 E Unit 29
- 5415 S 550 E
- 5415 S 550 E Unit 36
- 5390 S 550 E Unit 30
- 561 E 5350 S Unit 12
- 5404 S 550 E
- 571 E 5350 S Unit 13
- 5425 S 550 E Unit 53
Your Personal Tour Guide
Ask me questions while you tour the home.