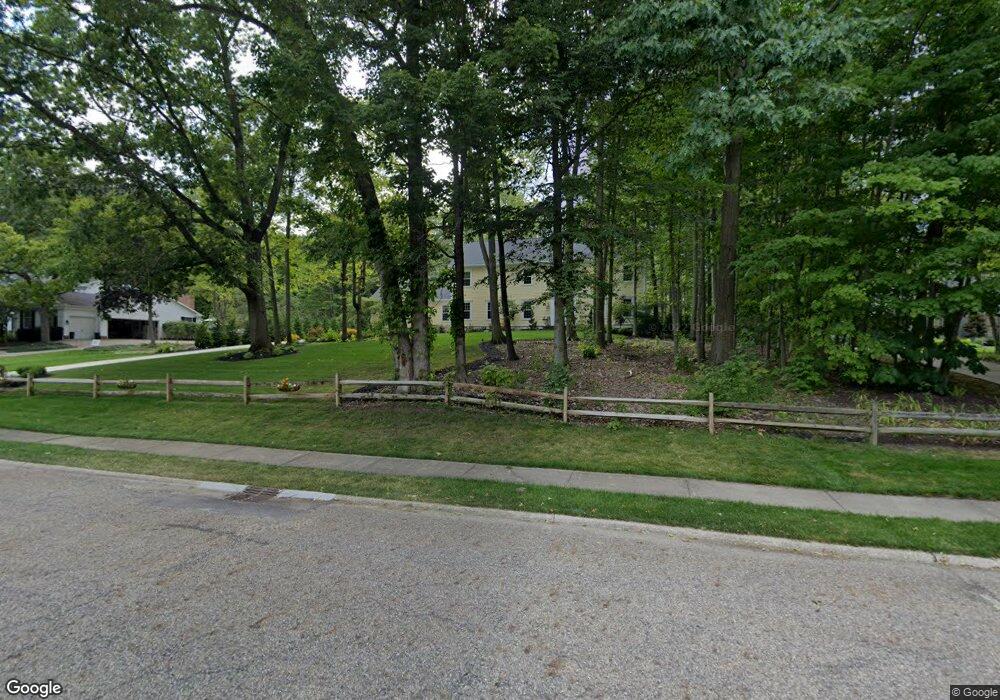
540 Fox Run Trail Aurora, OH 44202
Estimated Value: $541,000 - $662,000
4
Beds
3
Baths
3,832
Sq Ft
$154/Sq Ft
Est. Value
About This Home
This home is located at 540 Fox Run Trail, Aurora, OH 44202 and is currently estimated at $590,277, approximately $154 per square foot. 540 Fox Run Trail is a home located in Portage County with nearby schools including Miller Elementary School, Craddock/Miller Elementary School, and Leighton Elementary School.
Ownership History
Date
Name
Owned For
Owner Type
Purchase Details
Closed on
Aug 30, 2021
Sold by
George C And Marian Smith Family Limited
Bought by
George C Smith Iii Revocable Trust
Current Estimated Value
Purchase Details
Closed on
Dec 23, 2005
Sold by
Smith George C
Bought by
George C & Marian Smith Family Lp
Home Financials for this Owner
Home Financials are based on the most recent Mortgage that was taken out on this home.
Original Mortgage
$290,000
Interest Rate
1.2%
Mortgage Type
New Conventional
Purchase Details
Closed on
Dec 15, 2005
Sold by
Smith George C
Bought by
George C & Marian Smith Family Lp
Home Financials for this Owner
Home Financials are based on the most recent Mortgage that was taken out on this home.
Original Mortgage
$290,000
Interest Rate
1.2%
Mortgage Type
New Conventional
Purchase Details
Closed on
Aug 6, 1991
Bought by
Smith Family Limited
Create a Home Valuation Report for This Property
The Home Valuation Report is an in-depth analysis detailing your home's value as well as a comparison with similar homes in the area
Home Values in the Area
Average Home Value in this Area
Purchase History
| Date | Buyer | Sale Price | Title Company |
|---|---|---|---|
| George C Smith Iii Revocable Trust | -- | -- | |
| George C & Marian Smith Family Lp | -- | None Available | |
| Smith George C | -- | None Available | |
| George C & Marian Smith Family Lp | -- | Title Plus | |
| Smith George C | -- | Title Plus | |
| Smith Family Limited | -- | -- |
Source: Public Records
Mortgage History
| Date | Status | Borrower | Loan Amount |
|---|---|---|---|
| Previous Owner | Smith George C | $290,000 |
Source: Public Records
Tax History Compared to Growth
Tax History
| Year | Tax Paid | Tax Assessment Tax Assessment Total Assessment is a certain percentage of the fair market value that is determined by local assessors to be the total taxable value of land and additions on the property. | Land | Improvement |
|---|---|---|---|---|
| 2024 | $8,106 | $191,140 | $26,920 | $164,220 |
| 2023 | $7,466 | $145,150 | $26,920 | $118,230 |
| 2022 | $6,782 | $145,150 | $26,920 | $118,230 |
| 2021 | $6,852 | $145,150 | $26,920 | $118,230 |
| 2020 | $5,991 | $120,020 | $26,920 | $93,100 |
| 2019 | $6,023 | $120,020 | $26,920 | $93,100 |
| 2018 | $6,017 | $105,420 | $24,500 | $80,920 |
| 2017 | $5,741 | $105,420 | $24,500 | $80,920 |
| 2016 | $5,173 | $105,420 | $24,500 | $80,920 |
| 2015 | $5,320 | $105,420 | $24,500 | $80,920 |
| 2014 | $5,339 | $103,850 | $24,500 | $79,350 |
| 2013 | $5,336 | $103,850 | $24,500 | $79,350 |
Source: Public Records
Map
Nearby Homes
- 179 Fox Run Trail
- 314 E Pioneer Trail
- 635 Prestige Woods Blvd
- 109 S Chillicothe Rd
- 78 Chelmsford Dr
- V/L Ohio 82
- 824 S Chillicothe Rd Unit 11
- 350 Aspen Ct
- 126 Greenbriar Dr
- 159 Royal Oak Dr
- 69 E Mennonite Rd
- 221 Greenbriar Dr
- 0 Aurora Hill Dr Unit 3956102
- 270 Parkview Dr
- 504-9 Concord Downs Cir Unit 9
- 985 Goldenrod Trail Unit 16K
- 415 Normandy Ct
- 540 Bent Creek Oval
- 334 Rainbows End
- 339 Aberdeen Ln
- 506 Fox Run Trail
- 548 Fox Run Trail
- 521 Cobblestone Rd
- 509 Cobblestone Rd
- 541 Cobblestone Rd
- 500 Fox Run Trail
- 521 Fox Run Trail
- 429 Millpond Rd
- 409 Millpond Rd
- 505 Fox Run Trail
- 489 Cobblestone Rd
- 381 Millpond Rd
- 418 Fox Run Trail
- 503 Fox Run Trail
- 551 Fox Run Trail
- 454 Foxhill Dr
- 475 Cobblestone Rd
- 520 Cobblestone Rd
- 510 Cobblestone Rd
- 540 Cobblestone Rd