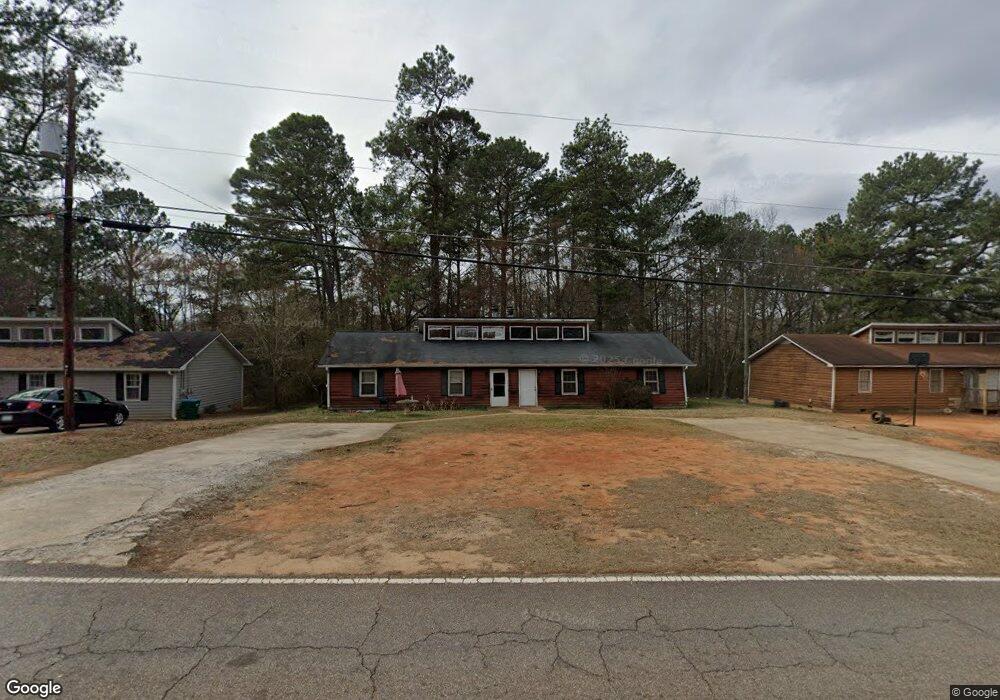
540 Freeman Dr Athens, GA 30601
Estimated Value: $241,633 - $277,000
Studio
2
Baths
1,848
Sq Ft
$143/Sq Ft
Est. Value
About This Home
This home is located at 540 Freeman Dr, Athens, GA 30601 and is currently estimated at $263,408, approximately $142 per square foot. 540 Freeman Dr is a home located in Clarke County with nearby schools including Fowler Drive Elementary School, Coile Middle School, and Cedar Shoals High School.
Ownership History
Date
Name
Owned For
Owner Type
Purchase Details
Closed on
Jun 7, 2022
Sold by
Bryja James H
Bought by
Homes For Eternity Llc
Current Estimated Value
Purchase Details
Closed on
Nov 7, 2002
Sold by
Compton Patricia A and Compton Tommie J
Bought by
Bryia James H and Susan Bryja
Purchase Details
Closed on
May 1, 2001
Sold by
Johnson Joyce and Johnson Fred C
Bought by
Compton Patricia A and Black Tommie J
Purchase Details
Closed on
Oct 8, 1998
Sold by
Tops Investment Trust I
Bought by
Johnson Joyce and Johnson Johnson
Purchase Details
Closed on
Nov 27, 1996
Sold by
Osbolt Terry
Bought by
Terry Osbolt Properties Inc
Purchase Details
Closed on
Jan 1, 1996
Sold by
Terry Osbolt Properties Inc
Bought by
Tops Investment Trust I
Purchase Details
Closed on
Feb 8, 1993
Sold by
Osbolt-Taylor Partnership
Bought by
Osbolt Terry
Purchase Details
Closed on
Sep 1, 1991
Sold by
Kempton Thomas J and Kempton Bonnie B
Bought by
Osbolt-Taylor Partnership
Create a Home Valuation Report for This Property
The Home Valuation Report is an in-depth analysis detailing your home's value as well as a comparison with similar homes in the area
Purchase History
| Date | Buyer | Sale Price | Title Company |
|---|---|---|---|
| Homes For Eternity Llc | -- | -- | |
| Bryia James H | $77,000 | -- | |
| Compton Patricia A | $67,900 | -- | |
| Johnson Joyce | $65,000 | -- | |
| Terry Osbolt Properties Inc | -- | -- | |
| Tops Investment Trust I | -- | -- | |
| Osbolt Terry | -- | -- | |
| Osbolt-Taylor Partnership | $46,100 | -- |
Source: Public Records
Tax History Compared to Growth
Tax History
| Year | Tax Paid | Tax Assessment Tax Assessment Total Assessment is a certain percentage of the fair market value that is determined by local assessors to be the total taxable value of land and additions on the property. | Land | Improvement |
|---|---|---|---|---|
| 2025 | $3,188 | $102,674 | $12,000 | $90,674 |
| 2024 | $3,188 | $87,796 | $12,000 | $75,796 |
| 2023 | $2,744 | $76,080 | $10,400 | $65,680 |
| 2022 | $1,891 | $59,266 | $10,400 | $48,866 |
| 2021 | $1,350 | $40,062 | $8,000 | $32,062 |
| 2020 | $1,243 | $36,875 | $8,000 | $28,875 |
| 2019 | $1,157 | $34,081 | $8,000 | $26,081 |
| 2018 | $1,083 | $31,887 | $7,200 | $24,687 |
| 2017 | $805 | $23,712 | $6,800 | $16,912 |
| 2016 | $805 | $23,712 | $6,800 | $16,912 |
| 2015 | $815 | $23,968 | $6,800 | $17,168 |
| 2014 | $733 | $21,513 | $6,800 | $14,713 |
Source: Public Records
Map
Nearby Homes
- 140 Loblolly Dr
- 121 Kenwood Dr
- 192 Sunny Hills Dr
- 495 Boley Dr
- 0 Danielsville Rd Unit 8926755
- 0 Danielsville Rd Unit 979729
- 210 Hull Rd
- 0 Old Commerce Rd Unit 10617666
- 175 Northcrest Dr
- 110 Connelly Cir
- 6006 Smokey
- 464 Ruth St
- 455 Ruth St
- 2146 Danielsville Rd
- 118 Ruth Dr Unit 130
- 118 Ruth Dr Unit 140
- 118 Ruth Dr Unit 310
- 118 Ruth Dr Unit 610
- 530 Freeman Dr Unit 2
- 530 Freeman Dr Unit 532
- 530 Freeman Dr Unit 530-32
- 530 Freeman Dr
- 550 Freeman Dr
- 0 Freeman Dr Unit CM416226
- 0 Freeman Dr Unit CM453454
- 602 Freeman Dr
- 542 Freeman Dr
- 520 Freeman Dr Unit 522
- 520 Freeman Dr
- 560 Freeman Dr
- 110 Loblolly Dr
- 565 Freeman Dr
- 575 Freeman Dr
- 575 Freeman Dr Unit Lot 8
- 555 Freeman Dr
- 120 Loblolly Dr Unit 2
- 120 Loblolly Dr
- 120 Loblolly Dr Unit 111