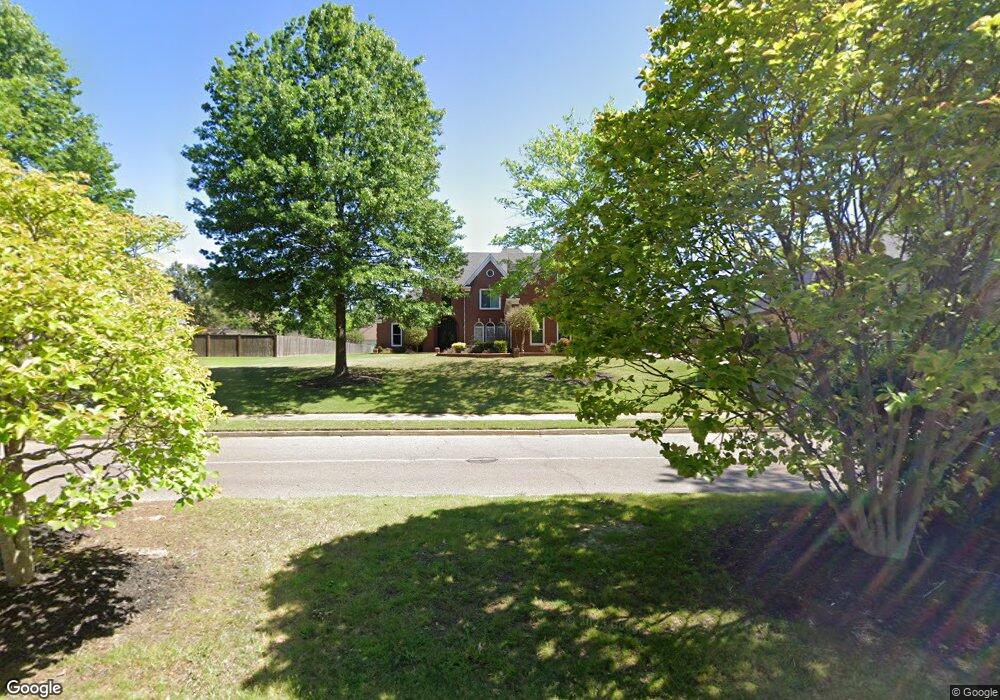
540 Itawamba Rd Collierville, TN 38017
Estimated Value: $560,156 - $681,000
5
Beds
4
Baths
4,708
Sq Ft
$129/Sq Ft
Est. Value
About This Home
This home is located at 540 Itawamba Rd, Collierville, TN 38017 and is currently estimated at $607,289, approximately $128 per square foot. 540 Itawamba Rd is a home located in Shelby County with nearby schools including Sycamore Elementary School, Collierville Middle School, and Collierville High School.
Ownership History
Date
Name
Owned For
Owner Type
Purchase Details
Closed on
Sep 26, 2003
Sold by
Mdm Co Llc
Bought by
Watson Gregory
Current Estimated Value
Home Financials for this Owner
Home Financials are based on the most recent Mortgage that was taken out on this home.
Original Mortgage
$266,800
Outstanding Balance
$46,182
Interest Rate
3.62%
Mortgage Type
Unknown
Estimated Equity
$561,107
Purchase Details
Closed on
Apr 11, 2003
Sold by
Fearnley Michael A
Bought by
Mdm Co/Quail Hollow Joint Venture
Purchase Details
Closed on
Jan 18, 2002
Sold by
Coury Michael P
Bought by
Fearnley Michael A
Home Financials for this Owner
Home Financials are based on the most recent Mortgage that was taken out on this home.
Original Mortgage
$213,200
Interest Rate
6.85%
Mortgage Type
Construction
Create a Home Valuation Report for This Property
The Home Valuation Report is an in-depth analysis detailing your home's value as well as a comparison with similar homes in the area
Home Values in the Area
Average Home Value in this Area
Purchase History
| Date | Buyer | Sale Price | Title Company |
|---|---|---|---|
| Watson Gregory | $333,500 | -- | |
| Mdm Co/Quail Hollow Joint Venture | -- | -- | |
| Fearnley Michael A | $206,800 | -- |
Source: Public Records
Mortgage History
| Date | Status | Borrower | Loan Amount |
|---|---|---|---|
| Open | Watson Gregory | $266,800 | |
| Previous Owner | Fearnley Michael A | $213,200 | |
| Closed | Watson Gregory | $66,700 |
Source: Public Records
Tax History Compared to Growth
Tax History
| Year | Tax Paid | Tax Assessment Tax Assessment Total Assessment is a certain percentage of the fair market value that is determined by local assessors to be the total taxable value of land and additions on the property. | Land | Improvement |
|---|---|---|---|---|
| 2025 | $3,955 | $145,950 | $28,250 | $117,700 |
| 2024 | $3,955 | $116,675 | $21,900 | $94,775 |
| 2023 | $6,102 | $116,675 | $21,900 | $94,775 |
| 2022 | $3,955 | $116,675 | $21,900 | $94,775 |
| 2021 | $7,001 | $116,675 | $21,900 | $94,775 |
| 2020 | $5,651 | $96,100 | $21,900 | $74,200 |
| 2019 | $3,892 | $96,100 | $21,900 | $74,200 |
| 2018 | $3,892 | $96,100 | $21,900 | $74,200 |
| 2017 | $3,950 | $96,100 | $21,900 | $74,200 |
| 2016 | $3,339 | $76,400 | $0 | $0 |
| 2014 | $3,339 | $76,400 | $0 | $0 |
Source: Public Records
Map
Nearby Homes
- 546 Township Cove
- 609 Ridge Peaks Dr
- 485 Indian Hollow Cove
- 1062 Center Ridge Rd
- 1225 Tuscumbia Rd
- 620 Ridge Springs Rd
- 609 Ridge Springs Rd
- 649 Ridge Springs Rd
- 11120 Shelby Post Rd
- 524 Tender Oaks Cove
- 350 Rolling Grove Blvd
- 344 Rolling Grove Blvd
- Rowan Copy Plan at Collierville - Woodgrove
- 817 Five Oaks Ln
- 27 ACRES Sycamore Rd
- 1349 Beautiful Place
- 11278 Ole Bob Dr
- 11508 Sunsparkler Way
- 11498 Sunsparkler Way
- 817 Bellflower Way
- 534 Itawamba Rd
- 550 Itawamba Rd
- 543 W Winoka Cove
- 1167 Winoka Rd
- 531 W Winoka Cove
- 1173 Winoka Rd
- 560 Itawamba Rd
- 526 Itawamba Rd
- 549 W Winoka Cove
- 525 W Winoka Cove
- 1020 S Byhalia Rd
- 530 W Winoka Cove
- 542 W Winoka Cove
- 548 W Winoka Cove
- 1168 Winoka Rd
- 1174 Winoka Rd
- 1162 Winoka Rd
- 524 W Winoka Cove
- 520 Itawamba Rd
- 1156 Winoka Rd