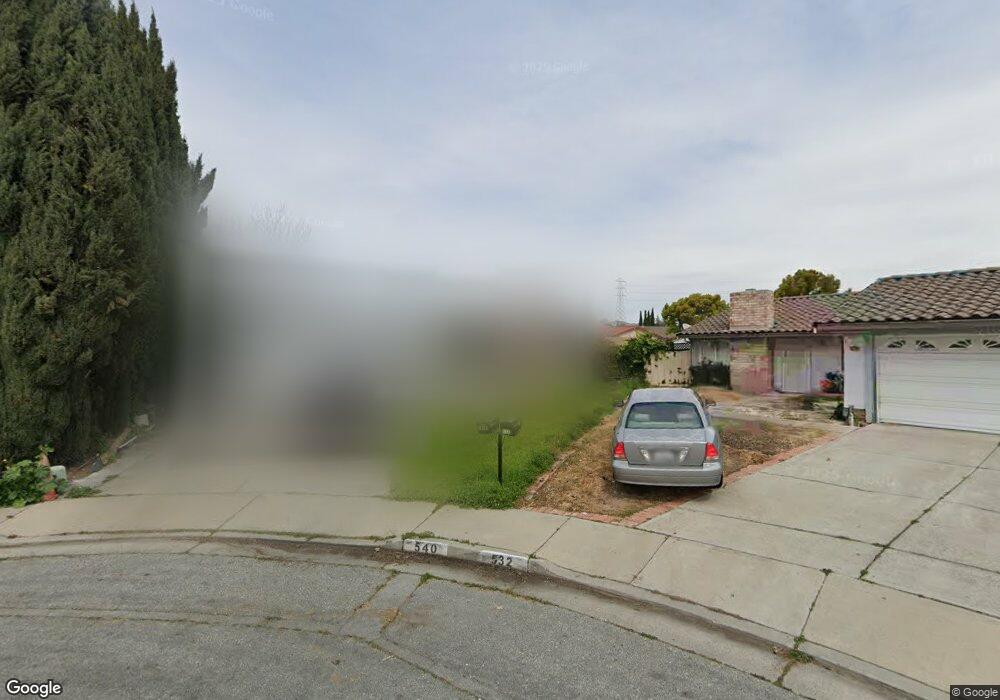
540 Lanning Ct San Jose, CA 95133
Commodore NeighborhoodEstimated Value: $1,178,000 - $1,393,000
4
Beds
3
Baths
1,041
Sq Ft
$1,203/Sq Ft
Est. Value
About This Home
This home is located at 540 Lanning Ct, San Jose, CA 95133 and is currently estimated at $1,252,109, approximately $1,202 per square foot. 540 Lanning Ct is a home located in Santa Clara County with nearby schools including Ben Painter Elementary School, William Sheppard Middle School, and Independence High School.
Ownership History
Date
Name
Owned For
Owner Type
Purchase Details
Closed on
Apr 5, 2019
Sold by
Ly Dieu and Pham Cuc Kim
Bought by
Ly Dieu and Pham Cuc Kim
Current Estimated Value
Home Financials for this Owner
Home Financials are based on the most recent Mortgage that was taken out on this home.
Original Mortgage
$150,000
Outstanding Balance
$132,142
Interest Rate
4.4%
Mortgage Type
Credit Line Revolving
Estimated Equity
$1,119,967
Purchase Details
Closed on
May 15, 2006
Sold by
Ly Dieu
Bought by
Ly Dieu and Pham Kim
Home Financials for this Owner
Home Financials are based on the most recent Mortgage that was taken out on this home.
Original Mortgage
$444,000
Interest Rate
6.41%
Mortgage Type
New Conventional
Purchase Details
Closed on
Sep 16, 2003
Sold by
Pham Cuc
Bought by
Ly Dieu
Home Financials for this Owner
Home Financials are based on the most recent Mortgage that was taken out on this home.
Original Mortgage
$318,750
Interest Rate
6.3%
Mortgage Type
Stand Alone First
Purchase Details
Closed on
Sep 11, 2003
Sold by
Bautista Maximilian and Bautista Jennifer
Bought by
Ly Dieu
Home Financials for this Owner
Home Financials are based on the most recent Mortgage that was taken out on this home.
Original Mortgage
$318,750
Interest Rate
6.3%
Mortgage Type
Stand Alone First
Purchase Details
Closed on
Mar 5, 2002
Sold by
Cruz Luis O and Cruz Rosalinda C
Bought by
Bautista Maximillan and Bautista Jennifer
Home Financials for this Owner
Home Financials are based on the most recent Mortgage that was taken out on this home.
Original Mortgage
$289,600
Interest Rate
6.94%
Purchase Details
Closed on
Sep 22, 1999
Sold by
Fong Evelaine
Bought by
Cruz Luis O and Cruz Rosalinda C
Home Financials for this Owner
Home Financials are based on the most recent Mortgage that was taken out on this home.
Original Mortgage
$256,200
Interest Rate
2.95%
Purchase Details
Closed on
Aug 25, 1998
Sold by
Rodriguez Joe B and Rodriguez Letetia H
Bought by
Fong Evelaine
Home Financials for this Owner
Home Financials are based on the most recent Mortgage that was taken out on this home.
Original Mortgage
$191,200
Interest Rate
6.91%
Mortgage Type
Stand Alone First
Create a Home Valuation Report for This Property
The Home Valuation Report is an in-depth analysis detailing your home's value as well as a comparison with similar homes in the area
Home Values in the Area
Average Home Value in this Area
Purchase History
| Date | Buyer | Sale Price | Title Company |
|---|---|---|---|
| Ly Dieu | $50,000 | Old Republic Title | |
| Ly Dieu | -- | Old Republic Title Company | |
| Ly Dieu | -- | Ticor Title Company | |
| Ly Dieu | $425,000 | Ticor Title Company | |
| Bautista Maximillan | $362,000 | Alliance Title Company | |
| Cruz Luis O | $285,000 | Financial Title Company | |
| Fong Evelaine | $239,000 | Financial Title Company |
Source: Public Records
Mortgage History
| Date | Status | Borrower | Loan Amount |
|---|---|---|---|
| Open | Ly Dieu | $150,000 | |
| Previous Owner | Ly Dieu | $444,000 | |
| Previous Owner | Ly Dieu | $318,750 | |
| Previous Owner | Bautista Maximillan | $289,600 | |
| Previous Owner | Cruz Luis O | $256,200 | |
| Previous Owner | Fong Evelaine | $191,200 | |
| Closed | Ly Dieu | $63,750 |
Source: Public Records
Tax History Compared to Growth
Tax History
| Year | Tax Paid | Tax Assessment Tax Assessment Total Assessment is a certain percentage of the fair market value that is determined by local assessors to be the total taxable value of land and additions on the property. | Land | Improvement |
|---|---|---|---|---|
| 2025 | $12,374 | $778,157 | $241,553 | $536,604 |
| 2024 | $12,374 | $762,900 | $236,817 | $526,083 |
| 2023 | $11,929 | $747,942 | $232,174 | $515,768 |
| 2022 | $11,677 | $733,277 | $227,622 | $505,655 |
| 2021 | $11,259 | $718,900 | $223,159 | $495,741 |
| 2020 | $8,438 | $552,180 | $220,871 | $331,309 |
| 2019 | $8,189 | $541,354 | $216,541 | $324,813 |
| 2018 | $8,081 | $530,741 | $212,296 | $318,445 |
| 2017 | $8,110 | $520,335 | $208,134 | $312,201 |
| 2016 | $7,652 | $510,133 | $204,053 | $306,080 |
| 2015 | $7,648 | $502,471 | $200,988 | $301,483 |
| 2014 | $7,122 | $492,629 | $197,051 | $295,578 |
Source: Public Records
Map
Nearby Homes
- 2420 Kita Ln
- 2432 Kita Ln
- 559 Apricot Way
- 571 Apricot Way
- 2580 Gimelli Way
- 370 Englert Ct
- 750 Fruit Ranch Loop
- 633 Easton Dr
- 2599 Easton Ln Unit 108
- 2599 Easton Ln Unit 109
- 2623 Gimelli Place Unit 139
- 709 Whitewater Ct Unit 44
- 674 Galleon Ct
- 230 Montclair Ave
- 2369 Mabury Rd
- 259 N Capitol Ave Unit 171
- 259 N Capitol Ave Unit 131
- 259 N Capitol Ave Unit 116
- 714 N Capitol Ave
- 210 Gramercy Place
- 532 Lanning Ct
- 541 Lanning Ct
- 2360 Brushglen Way
- 2364 Brushglen Way
- 528 Lanning Ct
- 537 Foundry Ct
- 2356 Brushglen Way
- 533 Lanning Ct
- 2366 Brushglen Way
- 545 Foundry Ct
- 529 Lanning Ct
- 2352 Brushglen Way
- 531 Foundry Ct
- 522 Lanning Ct
- 2368 Brushglen Way
- 523 Lanning Ct
- 525 Foundry Ct
- 538 Downsglen Way
- 542 Downsglen Way
- 534 Downsglen Way