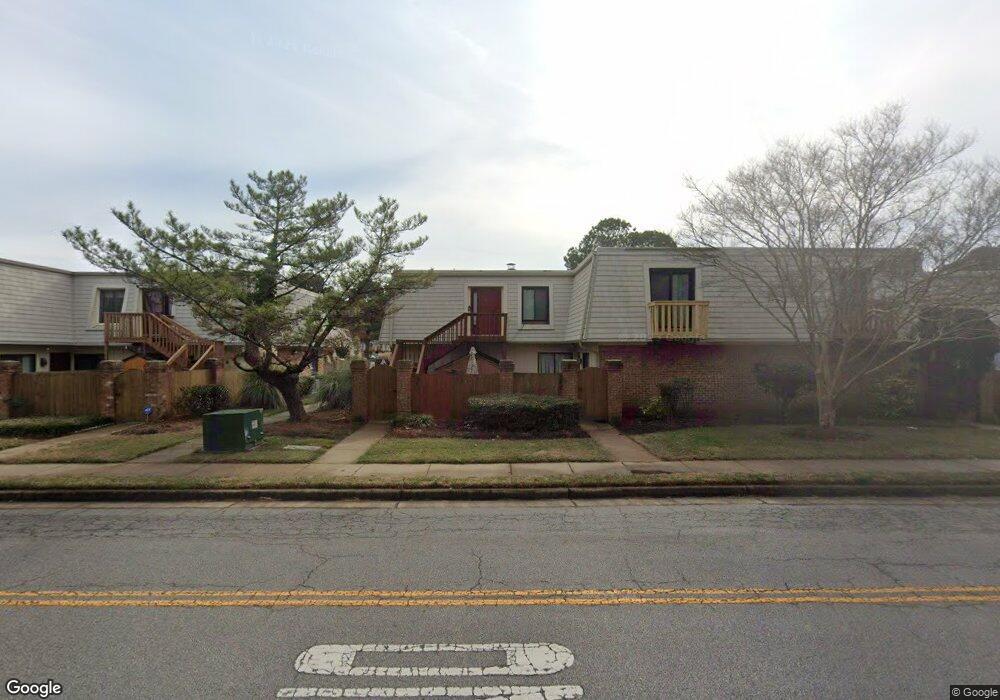
540 Marsh Duck Way Virginia Beach, VA 23451
Shadowlawn NeighborhoodEstimated Value: $268,661 - $280,000
2
Beds
2
Baths
948
Sq Ft
$288/Sq Ft
Est. Value
About This Home
This home is located at 540 Marsh Duck Way, Virginia Beach, VA 23451 and is currently estimated at $273,415, approximately $288 per square foot. 540 Marsh Duck Way is a home located in Virginia Beach City with nearby schools including W.T. Cooke Elementary School, Virginia Beach Middle School, and First Colonial High School.
Ownership History
Date
Name
Owned For
Owner Type
Purchase Details
Closed on
Aug 5, 2019
Sold by
Sirrine Scott William and Harrington-Sirrine Lisa Gay
Bought by
L & S Marsh Duck Properties Llc
Current Estimated Value
Purchase Details
Closed on
Jun 28, 2018
Sold by
Rubenstein Ronald and Rubenstein Paul J
Bought by
Harrington-Sirrine Lisa Gay and Sirrine Scott William
Home Financials for this Owner
Home Financials are based on the most recent Mortgage that was taken out on this home.
Original Mortgage
$120,750
Interest Rate
4.5%
Mortgage Type
New Conventional
Purchase Details
Closed on
Oct 15, 2014
Sold by
Kerzanet Daon L
Bought by
Rubenstein Ronald and Doyle Paul J
Home Financials for this Owner
Home Financials are based on the most recent Mortgage that was taken out on this home.
Original Mortgage
$122,800
Interest Rate
4.09%
Mortgage Type
New Conventional
Create a Home Valuation Report for This Property
The Home Valuation Report is an in-depth analysis detailing your home's value as well as a comparison with similar homes in the area
Home Values in the Area
Average Home Value in this Area
Purchase History
| Date | Buyer | Sale Price | Title Company |
|---|---|---|---|
| L & S Marsh Duck Properties Llc | -- | None Available | |
| Harrington-Sirrine Lisa Gay | $161,000 | Advance Title & Abstract Inc | |
| Rubenstein Ronald | $153,500 | -- |
Source: Public Records
Mortgage History
| Date | Status | Borrower | Loan Amount |
|---|---|---|---|
| Previous Owner | Harrington-Sirrine Lisa Gay | $120,750 | |
| Previous Owner | Rubenstein Ronald | $122,800 |
Source: Public Records
Tax History Compared to Growth
Tax History
| Year | Tax Paid | Tax Assessment Tax Assessment Total Assessment is a certain percentage of the fair market value that is determined by local assessors to be the total taxable value of land and additions on the property. | Land | Improvement |
|---|---|---|---|---|
| 2025 | $2,127 | $237,300 | $95,000 | $142,300 |
| 2024 | $2,127 | $219,300 | $95,000 | $124,300 |
| 2023 | $1,999 | $201,900 | $89,000 | $112,900 |
| 2022 | $1,820 | $183,800 | $75,000 | $108,800 |
| 2021 | $1,649 | $166,600 | $75,000 | $91,600 |
| 2020 | $1,695 | $166,600 | $75,000 | $91,600 |
| 2019 | $1,653 | $149,300 | $67,000 | $82,300 |
| 2018 | $1,497 | $149,300 | $67,000 | $82,300 |
| 2017 | $1,507 | $150,300 | $68,000 | $82,300 |
| 2016 | $1,489 | $150,400 | $69,600 | $80,800 |
| 2015 | $1,419 | $143,300 | $69,600 | $73,700 |
| 2014 | $1,405 | $145,100 | $74,600 | $70,500 |
Source: Public Records
Map
Nearby Homes
- 1026 Lands End Way
- 1022 Angler Ln
- 926 13th St
- 1308 Blue Pete Rd
- 1107 Ocean Pebbles Way
- 839 12th St
- 1127 Ocean Pebbles Way
- 1132 Ocean Pebbles Way
- 1021 Barclay Square
- 1341 Preserve Dr
- 1307 Parks Ave
- 1509 Parks Ave
- 1093 Kenya Ln
- 1609 Parks Ave
- 1207 Cypress Ave
- 729 Virginia Ave Unit X4660
- 1613 Parks Ave
- 629 12th St
- 625 13th St
- 731 Carolina Ave
- 542 Marsh Duck Way
- 550 Marsh Duck Way
- 544 Marsh Duck Way
- 552 Marsh Duck Way
- 532 Marsh Duck Way
- 532 Marsh Duck Way Unit 42B1
- 548 Marsh Duck Way
- 554 Marsh Duck Way
- 536 Marsh Duck Way
- 526 Marsh Duck Way
- 8 Norfolk Ave
- 530 Marsh Duck Way
- 537 Marsh Duck Way
- 533 Marsh Duck Way
- 539 Marsh Duck Way
- 546 Marsh Duck Way
- 522 Marsh Duck Way
- 529 Marsh Duck Way
- 535 Marsh Duck Way
- 1171 Lands End Way