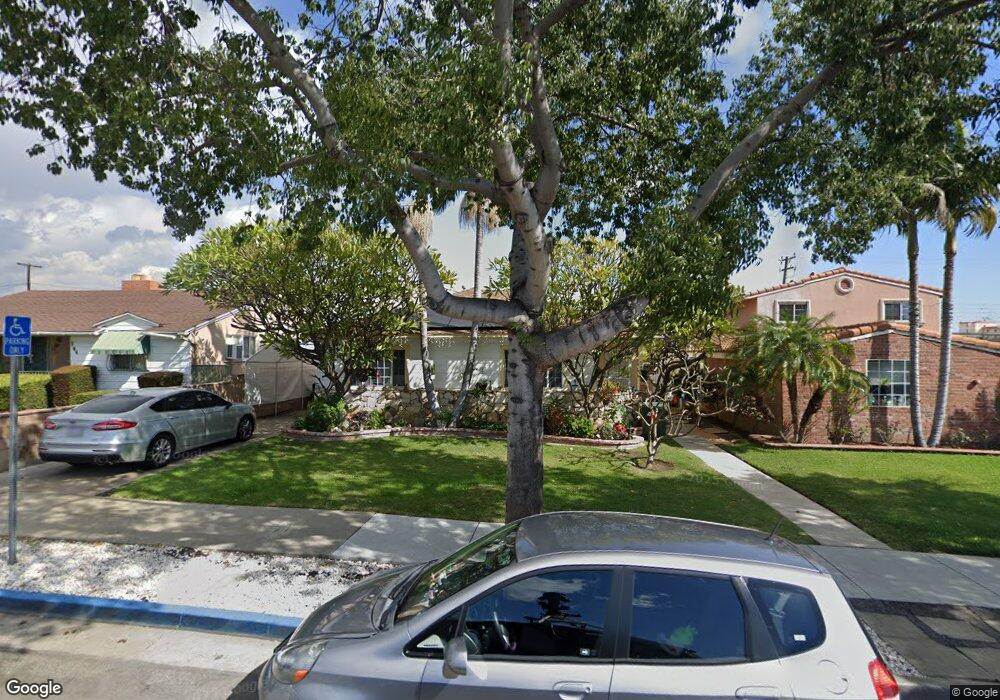
540 N 6th St Montebello, CA 90640
Estimated Value: $895,000 - $1,035,000
5
Beds
3
Baths
1,852
Sq Ft
$517/Sq Ft
Est. Value
About This Home
This home is located at 540 N 6th St, Montebello, CA 90640 and is currently estimated at $958,084, approximately $517 per square foot. 540 N 6th St is a home located in Los Angeles County with nearby schools including La Merced Elementary School, La Merced Intermediate School, and Montebello High School.
Ownership History
Date
Name
Owned For
Owner Type
Purchase Details
Closed on
Nov 11, 2025
Sold by
Perez Herminda
Bought by
2022 Perez Trust and Perez
Current Estimated Value
Purchase Details
Closed on
Jul 17, 2024
Sold by
2022 Perez Trust and Perez Herminda
Bought by
Perez Herminda and Ibarra Salvador
Purchase Details
Closed on
Sep 20, 2022
Sold by
Perez Herminda
Bought by
2022 Perez Trust and Perez
Purchase Details
Closed on
Dec 2, 2015
Sold by
Perez Herminda
Bought by
Perez Herminda and Ibarra Salvador
Home Financials for this Owner
Home Financials are based on the most recent Mortgage that was taken out on this home.
Original Mortgage
$275,000
Interest Rate
3.73%
Mortgage Type
New Conventional
Purchase Details
Closed on
Mar 19, 2002
Sold by
Hernandez Herminda and Hernandez Carlos Anthony
Bought by
Hernandez Roberto
Purchase Details
Closed on
Aug 21, 1996
Sold by
Hernandez Roberto
Bought by
Hernandez Herminda and Hernandez Carlos Anthony
Create a Home Valuation Report for This Property
The Home Valuation Report is an in-depth analysis detailing your home's value as well as a comparison with similar homes in the area
Home Values in the Area
Average Home Value in this Area
Purchase History
| Date | Buyer | Sale Price | Title Company |
|---|---|---|---|
| 2022 Perez Trust | -- | None Listed On Document | |
| Perez Herminda | -- | Chicago Title Company | |
| 2022 Perez Trust | -- | None Listed On Document | |
| Perez Herminda | -- | Chicago Title Company | |
| Hernandez Herminda | -- | Chicago Title Company | |
| Hernandez Roberto | -- | -- | |
| Hernandez Herminda | -- | -- |
Source: Public Records
Mortgage History
| Date | Status | Borrower | Loan Amount |
|---|---|---|---|
| Previous Owner | Perez Herminda | $275,000 |
Source: Public Records
Tax History
| Year | Tax Paid | Tax Assessment Tax Assessment Total Assessment is a certain percentage of the fair market value that is determined by local assessors to be the total taxable value of land and additions on the property. | Land | Improvement |
|---|---|---|---|---|
| 2025 | $11,231 | $565,654 | $374,012 | $191,642 |
| 2024 | $11,231 | $554,564 | $366,679 | $187,885 |
| 2023 | $11,208 | $543,691 | $359,490 | $184,201 |
| 2022 | $5,341 | $113,190 | $38,250 | $74,940 |
| 2021 | $5,245 | $110,971 | $37,500 | $73,471 |
| 2019 | $5,131 | $107,682 | $36,389 | $71,293 |
| 2018 | $5,066 | $105,572 | $35,676 | $69,896 |
| 2016 | $2,003 | $101,475 | $34,292 | $67,183 |
| 2015 | $1,917 | $99,951 | $33,777 | $66,174 |
| 2014 | $1,902 | $97,994 | $33,116 | $64,878 |
Source: Public Records
Map
Nearby Homes
- 633 N 6th St
- 217 Dochan Cir
- 1115 Sheila Ct
- 524 N Poplar Ave
- 344 N 1st St
- 704 N Poplar Ave
- 657 Wilber Place
- 416 W Cleveland Ave
- 211 Peacock Ln
- 424 Bradley Ave
- 708 Katherine Dr
- 132 N 2nd St
- 272 Maiden Ln
- 128 S 2nd St
- 653 N Raywood Ave
- 1001 W Yorktown Ave
- 133 N Greenwood Ave
- 713 N Orcutt Dr
- 478 Sycamore Dr W
- 8421 Culp Dr
Your Personal Tour Guide
Ask me questions while you tour the home.