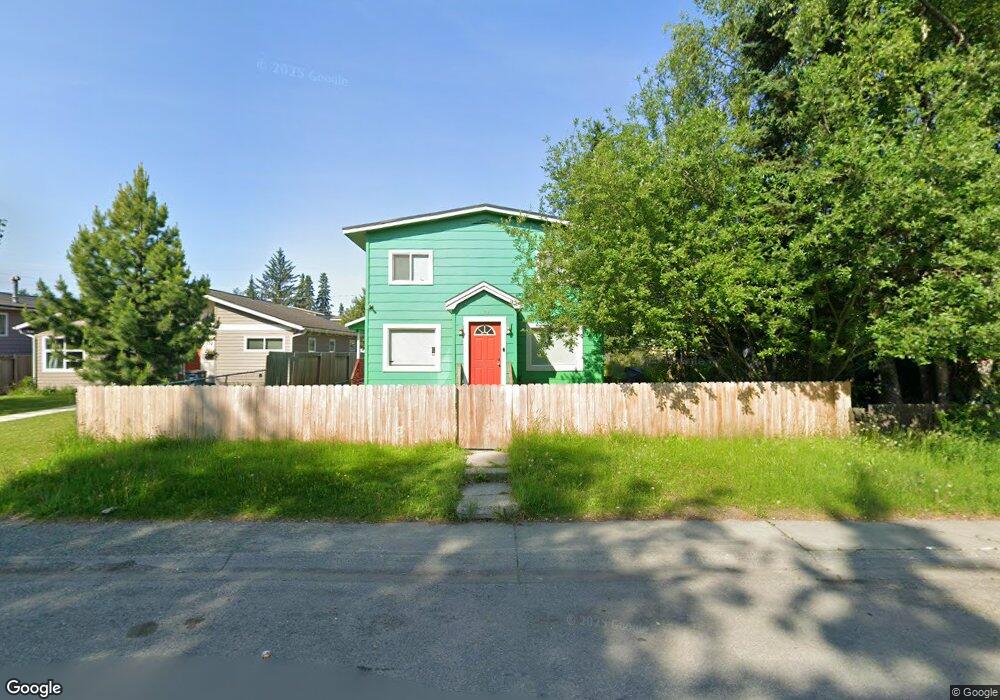
540 N Hoyt St Anchorage, AK 99508
Mountain View NeighborhoodEstimated Value: $160,000 - $454,475
5
Beds
3
Baths
2,468
Sq Ft
$140/Sq Ft
Est. Value
About This Home
This home is located at 540 N Hoyt St, Anchorage, AK 99508 and is currently estimated at $345,825, approximately $140 per square foot. 540 N Hoyt St is a home located in Anchorage Municipality with nearby schools including Mountain View Elementary School, Clark Middle School, and Bettye Davis East Anchorage High School.
Ownership History
Date
Name
Owned For
Owner Type
Purchase Details
Closed on
Oct 24, 2005
Sold by
Woodland Leigh S
Bought by
Myers Brandon K
Current Estimated Value
Home Financials for this Owner
Home Financials are based on the most recent Mortgage that was taken out on this home.
Original Mortgage
$255,884
Outstanding Balance
$136,183
Interest Rate
5.67%
Estimated Equity
$209,642
Purchase Details
Closed on
Oct 13, 2003
Sold by
Elledge James D and Elledge Diane S
Bought by
Woodland Leigh S
Home Financials for this Owner
Home Financials are based on the most recent Mortgage that was taken out on this home.
Original Mortgage
$2,429
Interest Rate
5.98%
Create a Home Valuation Report for This Property
The Home Valuation Report is an in-depth analysis detailing your home's value as well as a comparison with similar homes in the area
Home Values in the Area
Average Home Value in this Area
Purchase History
| Date | Buyer | Sale Price | Title Company |
|---|---|---|---|
| Myers Brandon K | -- | -- | |
| Woodland Leigh S | -- | -- |
Source: Public Records
Mortgage History
| Date | Status | Borrower | Loan Amount |
|---|---|---|---|
| Open | Myers Brandon K | $255,884 | |
| Previous Owner | Woodland Leigh S | $2,429 |
Source: Public Records
Tax History Compared to Growth
Tax History
| Year | Tax Paid | Tax Assessment Tax Assessment Total Assessment is a certain percentage of the fair market value that is determined by local assessors to be the total taxable value of land and additions on the property. | Land | Improvement |
|---|---|---|---|---|
| 2025 | $5,142 | $340,900 | $45,600 | $295,300 |
| 2024 | $5,142 | $318,500 | $45,600 | $272,900 |
| 2023 | $4,721 | $277,200 | $45,600 | $231,600 |
| 2022 | $4,397 | $261,100 | $45,600 | $215,500 |
| 2021 | $4,359 | $241,900 | $45,600 | $196,300 |
| 2020 | $4,728 | $278,100 | $60,300 | $217,800 |
| 2019 | $4,560 | $278,700 | $60,300 | $218,400 |
| 2018 | $4,490 | $273,800 | $60,300 | $213,500 |
| 2017 | $4,416 | $282,000 | $60,300 | $221,700 |
| 2016 | $3,617 | $277,500 | $60,300 | $217,200 |
| 2015 | $3,617 | $270,200 | $60,300 | $209,900 |
| 2014 | $3,617 | $259,300 | $60,300 | $199,000 |
Source: Public Records
Map
Nearby Homes
- 617 N Park St
- 4321 Thompson Ave
- 802 N Bunn St
- 741 N Klevin St
- 432 N Bunn St
- 428 N Bunn St
- 401 N Klevin St
- 716 N Flower St
- 808 N Flower St
- 741 N Bliss St
- 330 N Bliss St
- 415 N Bragaw St
- 740 N Bragaw St
- 203 N Hoyt St
- 601 Irwin St
- 509 Irwin St
- 138 N Klevin St
- 128 N Klevin St
- 735 Price St
- 124 N Flower St